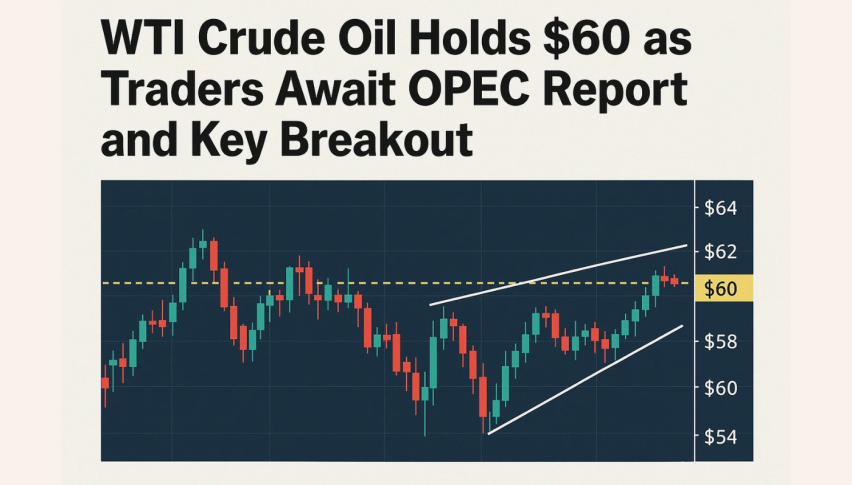
WTI Crude Oil Holds $60 as Traders Await OPEC Report and Key Breakout
WTI crude oil futures hovered near $60.80 per barrel on Tuesday, halting a three-day rally as investors awaited crucial supply and demand...
Quick overview
- WTI crude oil futures are currently around $60.80 per barrel, pausing after a three-day rally as investors await key supply and demand reports from OPEC and the IEA.
- Recent U.S. sanctions on Russian energy firms have disrupted international crude flows, while Saudi Arabia, Iraq, and Kuwait are increasing exports to India.
- Technically, WTI crude is forming a symmetrical triangle, indicating potential for a significant price movement, with resistance noted around $61.48.
- Traders are advised to wait for a clear breakout above $61.50 for bullish signals or a drop below $60.00 for bearish trades.
WTI crude oil futures hovered near $60.80 per barrel on Tuesday, halting a three-day rally as investors awaited crucial supply and demand projections from OPEC and the International Energy Agency (IEA). Both reports, expected later today, are likely to shape near-term sentiment by outlining production trends and consumption forecasts through 2026, as oversupply fears continue to dominate the global crude market.
Optimism also persists that the U.S. government shutdown could soon be resolved, supporting broader risk appetite and energy demand expectations.
Supply Shifts Reshape Market Flows
Recent U.S. sanctions on Russian energy firms have begun to disrupt international crude flows. Russia’s Lukoil declared force majeure at an Iraqi oil field — the most significant disruption tied to sanctions so far. Meanwhile, Saudi Arabia, Iraq, and Kuwait are set to boost December exports to India, as refiners look to diversify away from Russian supply.
These developments have created a mixed outlook for crude — balancing bullish supply disruptions with bearish oversupply concerns in Asian markets.
WTI Crude Oil (USOIL) Technical View: Triangle Signals Breakout Setup
From a technical perspective, WTI crude is trading within a symmetrical triangle, a pattern that often precedes sharp directional moves. The price rebounded from the 38.2% Fibonacci retracement at $60.06, supported by an ascending trendline from the $55.96 low.
However, a spinning top candle near $61.48 shows hesitation, with multiple rejections suggesting short-term resistance. The RSI near 57 points to neutral momentum, confirming a balance between buyers and sellers.
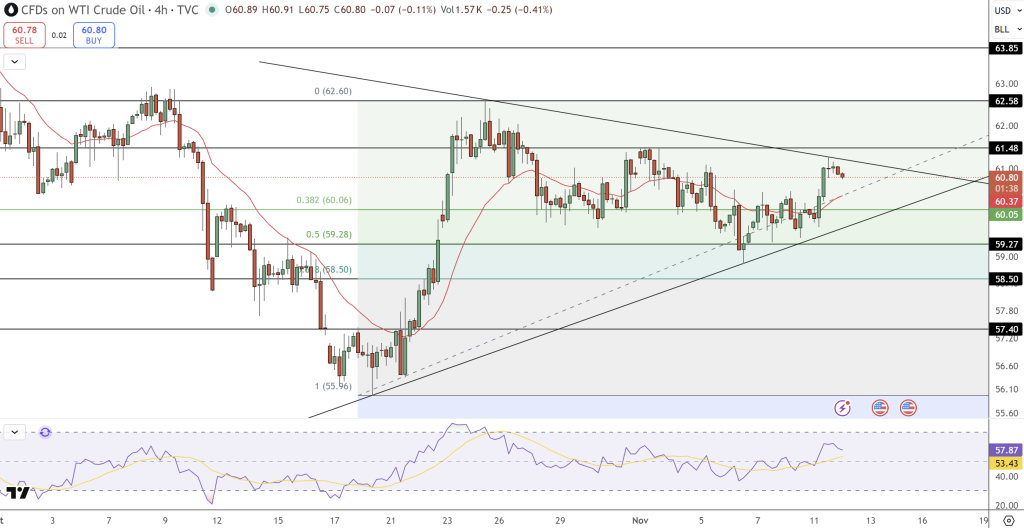
If bulls break above $61.50, the next targets lie near $62.58 and $63.80, aligning with prior swing highs. Conversely, a drop below $60.00 could shift bias downward toward $59.20 and $58.50.
WTI Crude Oil (USOIL) Traders Watch for Directional Clarity
For traders, the ideal setup is to wait for a decisive breakout. A move above $61.50 could validate a bullish run, while a drop under $60.00 would favor short trades. Until then, oil’s tight range reflects a cautious mood — as the market awaits signals from OPEC, the IEA, and the broader macro environment.
- Check out our free forex signals
- Follow the top economic events on FX Leaders economic calendar
- Trade better, discover more Forex Trading Strategies
- Open a FREE Trading Account
- Read our latest reviews on: Avatrade, Exness, HFM and XM
Related Articles


Sidebar rates
Related Posts
