Solana Tests Critical $140 Support as Market Sentiment Turns Bearish
Solana (SOL) is under a lot of pressure right now. It is trading over $145, down more than 5% in the last 24 hours. This is the latest drop
Quick overview
- Solana (SOL) is currently trading at over $145, down more than 5% in the last 24 hours, marking a 52% decline from its all-time high earlier this year.
- User engagement on the Solana network has hit a 12-month low, with daily active addresses dropping to 3.3 million from over 9 million, indicating a significant reduction in speculative trading.
- The FTX/Alameda bankruptcy estate continues to release tokens, adding to selling pressure, while institutional ETF inflows have brought in $336 million over the past week.
- Technical analysis suggests that the $140 support level is critical for Solana, with potential further declines if this level fails to hold.
Solana SOL/USD is under a lot of pressure right now. It is trading over $145, down more than 5% in the last 24 hours. This is the latest drop in a painful 52% drop from its all-time high of $293.31 earlier this year. The Layer 1 blockchain was originally boosted by President Trump’s meme currency debut and a surge in retail activity. Now, however, it is facing a number of bearish circumstances that have traders wondering if it can keep important support levels.
Solana’s Memecoin Hype Fades, User Engagement Hits 12-Month Low
The engine that drove Solana’s rapid development has stopped working. According to data from Glassnode and The Block, the number of daily active addresses has dropped to 3.3 million from over 9 million at the start of 2025. This is the lowest number in a year. This huge 63% reduction shows that a lot of speculative traders and automated bots left the network during the memecoin craze.
The cooling of retail speculation has immediate effects on the fundamentals of the network. Fee income has gone down and liquidity has gone down, which makes SOL more likely to have big price swings. Solana’s DeFi total value locked is still strong at about $10 billion, thanks to protocols like Jupiter, Jito, and Kamino. However, the network has to recruit “stickier” members through useful apps for payments, games, and real-world assets in order to keep growing once the speculative cycles end.
Alameda’s SOL Unlocks Clash With Institutional ETF Demand
The FTX/Alameda bankruptcy estate is still releasing tokens as planned, which adds to selling pressure. On November 11, 193,000 SOL ($30 million) were unstaked as part of a vesting schedule that would last until 2028. These unlocks often make things harder because tokens move to exchanges.
But what institutions want is a different story. Solana has had ETF inflows for 10 to 11 days in a row, bringing in $336 million for the week. Bitwise and Grayscale Solana ETFs currently have a total of $351 million in assets. Traditional finance companies like Rothschild Investment and PNC Financial Services have also announced fresh stakes. SoFi Bank’s recent decision to allow direct SOL purchases from U.S. checking accounts is further sign that Solana is a legitimate institution.
This back-and-forth between systematic selling pressure and rising institutional inflows is what makes Solana’s volatility profile right now, and it will probably affect prices in the near future.
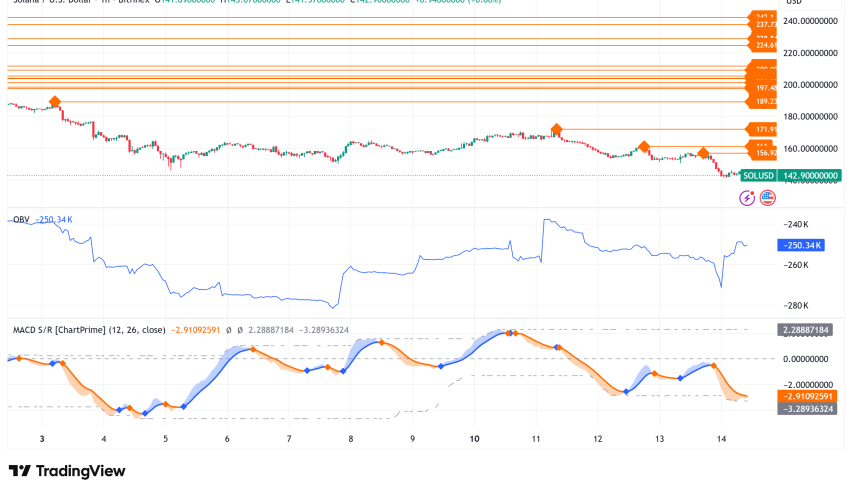
SOL/USD Technical Analysis: $140 Emerges as Make-or-Break Level
From a technical point of view, SOL has dropped below the $156 support level on significant volume, which is a worrying trend of lower highs and lower lows that has been going on since early November. Key signs point to a bearish picture:
The On-Balance Volume (OBV) keeps going down, which means that sellers are still in charge and buyers are not very sure about their purchases. The MACD on the hourly chart is getting stronger in bearish territory, and the Relative Strength Index has dropped below the important 50 level, confirming negative momentum.
There is a negative trend line on the hourly chart, and it is hard to break through at $148. The first level of resistance is between $148 and $152, and the next big one is at $160, which is the 61.8% Fibonacci retracement level of the recent drop from $172 to $141.
Liquidity heatmaps show that there are strong magnetic zones at $144 and $140, which means that it is quite likely that these levels will be tested again soon. Most analysts see $140 as the line in the sand. If it fails, it could start a chain reaction that leads to $132, and if that support breaks, it could go even lower to $120.
Market Sentiment Collapses: Only 10% Chance of New ATH by Year-End
Myriad’s prediction market data shows how traders’ feelings have changed dramatically. Predictors currently say that there is only a 10.4% chance that Solana will reach a new all-time high before 2026. This is down from 56% in mid-October and 65% in September. This 46-point drop in one month shows how swiftly trust has fallen as the overall crypto market declines and Bitcoin has trouble staying over $100,000.
Solana Price Prediction: Near-Term Outlook Remains Challenging
The technical setting and eroding fundamentals signal that SOL is likely to lose more value in the next few weeks. The most likely thing to happen is that the price will test the $140 support zone. If institutional ETF flows stay consistent and Bitcoin stays above $98,000–$100,000, it could bounce back.
If the Federal Reserve makes it clear what it expects to do with interest rates in December and people are more willing to take risks, a successful defense of $140 might lead to a surge toward $165–$180. But if it doesn’t hold $140, it might drop to $120, which would be another 17% drop from where it is now.
For bulls to get back in charge, SOL needs to go back to $160 and make it a support level. This seems improbable right now because of the present momentum and the macro headwinds that risk assets are facing. Solana looks like it could drop any more until user engagement picks up if fresh catalysts arrive. This is because the speculative excitement that drove its 2025 run is fading.
- Check out our free forex signals
- Follow the top economic events on FX Leaders economic calendar
- Trade better, discover more Forex Trading Strategies
- Open a FREE Trading Account
- Read our latest reviews on: Avatrade, Exness, HFM and XM
Related Articles


Sidebar rates
Related Posts
