Microsoft Stock Pulls Back: Is This the Beginning of a Major Downtrend?
Written by:
Konstantin Kaiser•Saturday, November 15, 2025•3 min read
•Last updated: Saturday, November 15, 2025
Quick overview
Microsoft's stock has experienced significant volatility, oscillating between $492 and $555 over the past five months.
Key support levels include $475.40 (0.382 Fibonacci retracement) and $420 (golden ratio), while resistance is found at $513 (50-day EMA) and $530 (golden ratio).
Despite a bullish long-term trend indicated by EMA crossovers, momentum signals are weakening, suggesting potential for a corrective phase.
A decisive break above $530 could lead to new all-time highs, while a drop below $475 may trigger a deeper correction.
Microsoft has seen unusually high volatility over the past five months. The stock recently printed a new all-time high at $555.50—yet the price action continues to show instability beneath the surface, repeatedly swinging between $492 and $555.
Microsoft Stock (MSFT) Approaches Key Fibonacci Support Levels
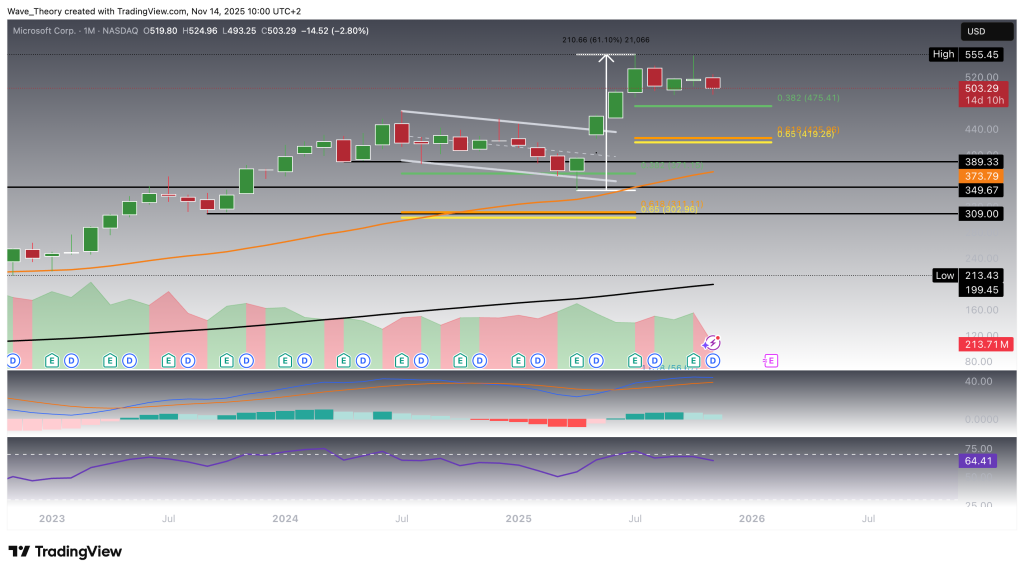
Microsoft (MSFT) has spent the past five months oscillating within a broad consolidation range between $492 and $555, following a powerful advance from roughly $350 to $555 in the four months prior—a move that delivered an impressive 61% gain. This extended sideways structure now carries a clear corrective tone, and price is beginning to gravitate toward the next meaningful retracement levels.
The first key downside target sits at the 0.382 Fibonacci retracement at $475.4. A confirmed breakdown below this level would expose MSFT to its next major support zone at the 0.618 “golden ratio” at $420, which represents the deepest retracement that can occur while preserving the structural integrity of the broader uptrend.
From an indicator standpoint, the monthly MACD lines remain in a bullish crossover, reflecting intact long-term momentum, but the MACD histogram has been declining since last month, signaling waning upside momentum. Meanwhile, the RSI remains in neutral territory but is edging toward overbought conditions, further supporting the likelihood of continued corrective price action before a sustained trend resumes.
Moreover, the golden EMA crossover remains firmly intact, reinforcing that the broader long-term trend continues to lean bullish, even as short-term pressures build.
Microsoft
Microsoft Stock (MSFT) Finds Additional Support at the 50-Week EMA
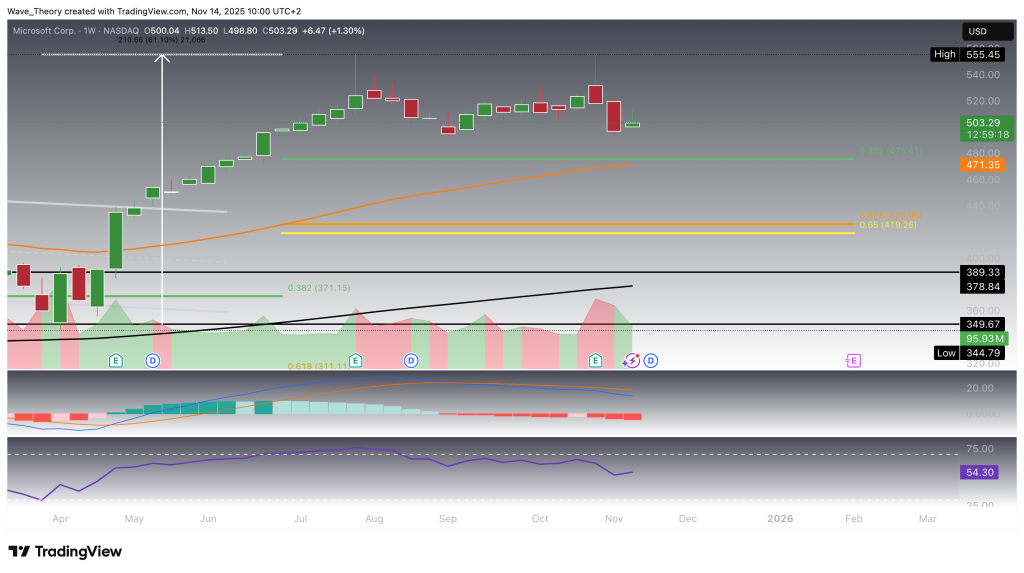
Just below the key 0.382 Fibonacci support at $475, Microsoft (MSFT) finds another significant level at the 50-week EMA around $471, adding confluence to the current support zone. Further below, the 200-week EMA at roughly $379 provides additional structural support within the broader historical demand area between $350 and $390. If MSFT loses its immediate Fib levels, price could ultimately revisit this deeper support cluster.
From a technical-indicator standpoint, the signals remain mixed. The EMA structure still maintains a golden crossover, confirming that the mid-term trend remains bullish. However, the MACD lines are bearishly crossed, and the MACD histogram has declined for three consecutive weeks, reflecting weakening momentum. Meanwhile, the RSI continues to hover in neutral territory, offering no strong directional bias.
Microsoft
Microsoft Stock (MSFT) Faces Rejection at the 50-Day EMA
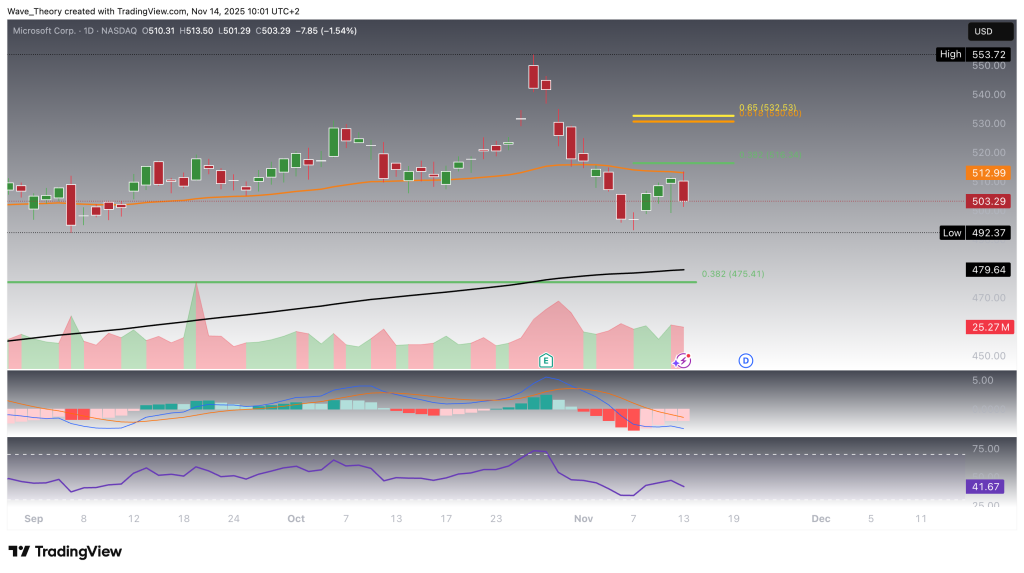
MSFT is currently encountering resistance at the 50-day EMA near $513, where today’s price action shows a clear rejection. This increases the probability of a retracement toward the recent local low at $492.40, or even a deeper pullback into the 200-day EMA at $479.60, which sits just above the 0.382 Fibonacci support at $475.
Despite today’s bearish reaction, momentum signals are showing early improvement. The MACD histogram has been rising for four consecutive sessions, and the EMAs continue to maintain a golden crossover, keeping the short- to medium-term trend structurally bullish. However, the MACD lines remain bearishly crossed, and the RSI is neutral, offering no immediate directional confirmation.
If Microsoft initiates a new impulse to the upside, it faces notable Fibonacci resistances at $516 and $530. A decisive break above the golden ratio at $530 would invalidate the broader corrective structure and open the door for a retest of the all-time high at $555, with the potential for continuation into price discovery.
Microsoft
A Rare Occurrence: The 50-4H EMA Aligns Perfectly With the 50-Day EMA
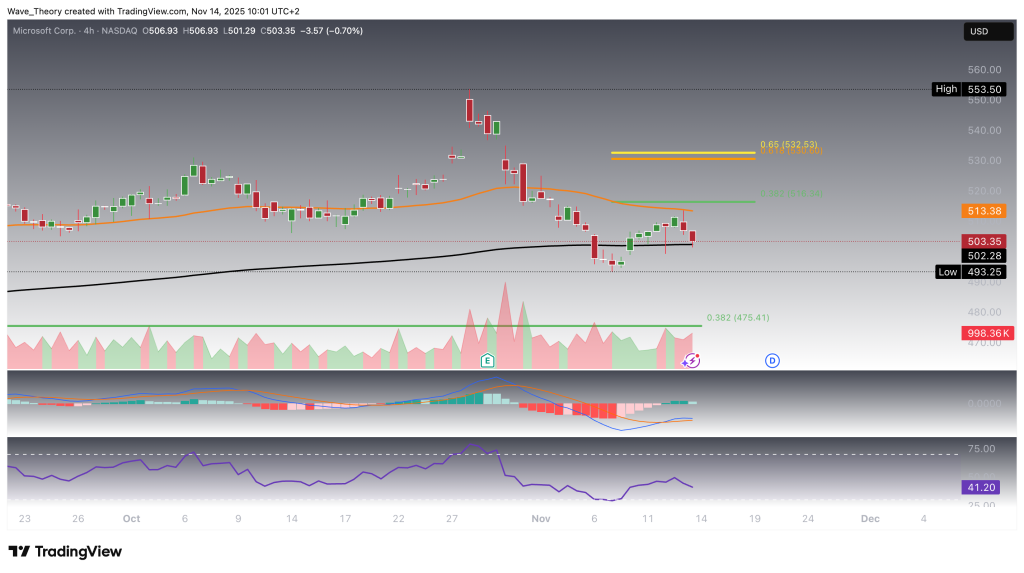
On the 4-hour chart, an unusual technical alignment appears: the 50-4H EMA matches the exact value of the 50-day EMA. This is a rare scenario and implies that the market’s exponentially weighted price behavior over the past 8 days mirrors that of the past 50 days. In other words, short-term and medium-term momentum have been moving in near-perfect sync—often a precursor to an inflection.
At the moment, Microsoft is finding meaningful support at the 200-4H EMA around $502.30, a level that could facilitate a bullish rebound. To the upside, however, the 50-4H EMA at $513 remains a major resistance zone—the exact level where MSFT recently encountered rejection.
The EMA structure on the 4H chart still displays a golden crossover, maintaining a bullish trend bias even in the short-term. But momentum is beginning to soften: the MACD histogram has started to tick lower, and the MACD lines are on the verge of a bearish cross, signalling potential short-term weakness. The RSI remains neutral, offering no divergence or directional edge for now.
Microsoft
MSFT Technical Summary — Key Levels & Outlook
Microsoft has been consolidating between $492 and $555 for five months after rallying 61% from $350 to $555. The broader structure shows signs of a corrective phase, with major downside levels now in focus.
Key Support Levels
$502 — 200-4H EMA
$492.40 — recent local low
$479.60 — 200-day EMA
$475.40 — 0.382 Fib support
$420 — golden ratio Fib support
$350–390 — historical support zone aligned with the 200-week EMA (~$379)
Key Resistance Levels
$513 — 50-day-EMA
$516 — first major Fib resistance
$530 — golden ratio resistance (breakout level; correction invalidation)
Weekly MACD: bearish cross; histogram falling for three weeks
Monthly, Weekly, Daily/4H EMAs: golden crossovers intact (bullish structure)
RSI: neutral across all timeframes
Rare signal: 50-4H EMA = 50-day EMA → short-term momentum mirroring mid-term trend
Bottom Line
MSFT remains structurally bullish in the medium term due to sustained EMA golden crossovers, but momentum continues to weaken. A break below $475 risks a deeper correction toward the $420 Fib and potentially the $379 weekly EMA support. Conversely, a break above $530 would invalidate the correction and reopen the path toward $555 and new highs.
Konstantin Kaiser comes from a data science background and has significant experience in quantitative trading. His interest in technology took a notable turn in 2013 when he discovered Bitcoin and was instantly intrigued by the potential of this disruptive technology.