XRP Faces Bearish Technical Headwinds: $2.1 Support at Risk of Breakdown to $1.55
At the time of writing, XRP is trading above $2.10. It has been rather stable over the previous 24 hours, even though technical, fundamental
Quick overview
- XRP is currently trading above $2.10 but has dropped about 11% since last week, with experts predicting a potential fall to $1.55.
- Technical analysis indicates a descending triangle pattern, suggesting a major breakdown risk if support levels fail.
- Network activity has significantly declined, with daily active addresses dropping over 92%, raising concerns about XRP's medium-term future.
- Despite bearish signals, the launch of U.S. spot XRP ETFs has generated institutional interest, providing a glimmer of hope for long-term price recovery.
At the time of writing, XRP XRP/USD is trading above $2.10. It has been rather stable over the previous 24 hours, even though technical and fundamental factors are building that imply a big fall could be coming. The price of the cryptocurrency has dropped about 11% since last week, and experts are warning that a number of bearish signals might push it down to $1.55, which would be a 25% drop from where it is now.
Descending Triangle Pattern Signals Major Breakdown Risk
According to technical research, XRP’s eight-hour chart shows that it has confirmed a descending triangle pattern after dropping below the important $3 psychological level in October. This bearish pattern has a flat support line and a downward-sloping resistance trendline. It usually ends with a breakdown below support, followed by a price drop equal to the triangle’s maximum height.
XRP broke below the $2.20 support line on Monday, which reinforced the trend. Right now, bulls are trying to protect the $2 support zone. If they can’t, the price might quickly drop to the calculated objective of $1.55 by the end of November. This prediction is in line with earlier technical warnings that said $1.61 might be a downward target if critical support levels collapse.
Glassnode distribution data shows a large supply cluster between $2.38 and $2.40, where over 3.23 billion XRP were bought. This adds to the pessimistic thesis. The 100-day simple moving average and the triangle’s resistance line make this zone a strong overhead barrier that could stop any attempts to recover.
Bearish RSI Divergence Points to Weakening Momentum
The weekly relative strength index (RSI) is showing signals of trouble with a strong bearish divergence. XRP’s price went up from November 2024 to July 2025, making higher highs in a rising channel. At the same time, the weekly RSI went down from 92 to 68, making lower highs. In an uptrend, this divergence usually means that there is weakness behind it, which could mean that buyers are getting tired and profit-taking is getting stronger.
The RSI has since dropped to 39, which is solidly in negative territory and shows that sellers are still in charge of the market. The 50-week simple moving average around $2.32 is also a big barrier for XRP, which might keep prices from moving for a few weeks.
Short-Term Technical Outlook: Testing Critical Support
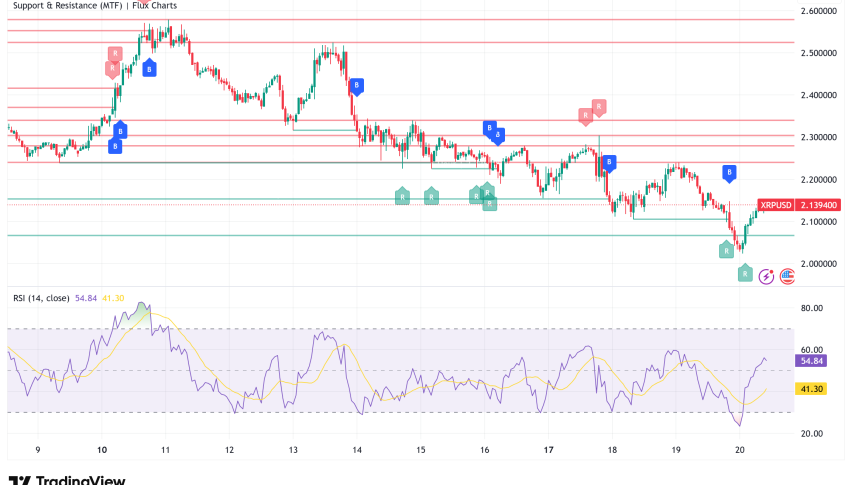
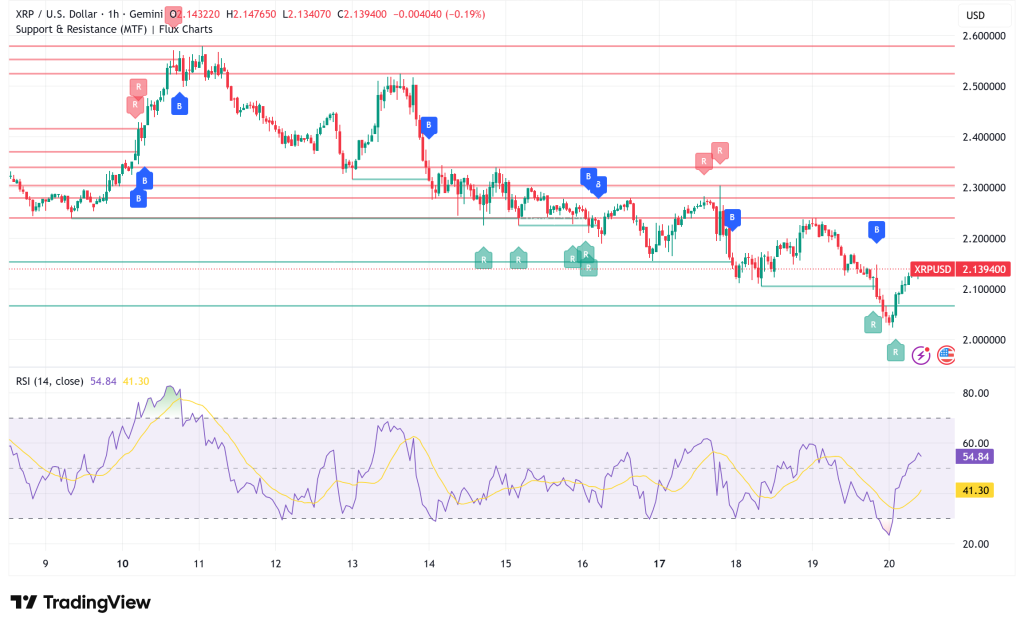
XRP is currently challenging the $2.050-$2.020 support zone on shorter time frames. It just made a low at $2.025. There is a negative trendline building on the hourly chart at $2.150, which is where the asset is currently facing opposition. The simple moving average over 100 hours is likewise pushing down.
XRP has to get back to the $2.20 level for any real recovery to happen. This would open the door to $2.250 and maybe even $2.2750. If it doesn’t break through $2.150, though, it could go down again, with $2.050 as the first support level and $2.020 as the most important support level. A drop below $2.020 might make selling pressure rise near $1.965 and maybe even $1.920.
Network Activity Collapse Raises Red Flags
The XRP Ledger network has seen a huge drop in activity over the past four months, which is probably the most worrying thing for XRP’s medium-term future. Daily active addresses have dropped by more than 92%, from a high of 577,000 on June 14 to only 44,000 now. This sudden decline in user transactions could mean that people are less interested in XRP or that they don’t trust its short-term future.
The number of new addresses being created has also dropped sharply, from 13,500 per day on November 10 to about 4,000 now. It’s especially worrying that fewer people are using and adopting networks, because historical data suggests that less network activity usually comes before prices staying the same or dropping even more because of lower liquidity and weaker buying enthusiasm.
XRP ETF Momentum Provides Glimmer of Hope Amid Technical Weakness
The negative technical picture is at odds with the positive news coming from institutions. In November 2025, the launch of U.S. spot XRP ETFs drew a lot of attention from institutions. For example, Canary Capital’s XRPC had over $58 million in trading on its first day. Franklin Templeton’s request to list the Franklin XRP ETF on NYSE Arca means that more institutional products are on the way.
However, economists warn that ETF inflows have settlement lags and usually go through OTC desks, so the actual price effect may not happen right away. Open interest has grown from $1 billion in October to more than $6 billion now. This shows that traders are still quite interested even though prices are low.
XRP Price Prediction: $1.55 Target in Focus, But Long-Term Optimism Persists
According to the technical analysis, XRP might fall to $1.55 if the $2 support level fails. This would be a drop of almost 25% from where it is now. The fight is going on right now between $2.10–$2.05, and a clear breakdown could happen fast because the network fundamentals are weak and the technical setting is bearish.
If bulls can defend and go back to $2.20, then $2.32, XRP might stabilize and aim for $2.50–$2.75 in a recovery scenario. Some analysts still think that long-term expectations are good. They say that if ETF inflows increase and the market becomes better, prices might go up to $6 to $25.
- Check out our free forex signals
- Follow the top economic events on FX Leaders economic calendar
- Trade better, discover more Forex Trading Strategies
- Open a FREE Trading Account
- Read our latest reviews on: Avatrade, Exness, HFM and XM
Related Articles
Sidebar rates
Related Posts
