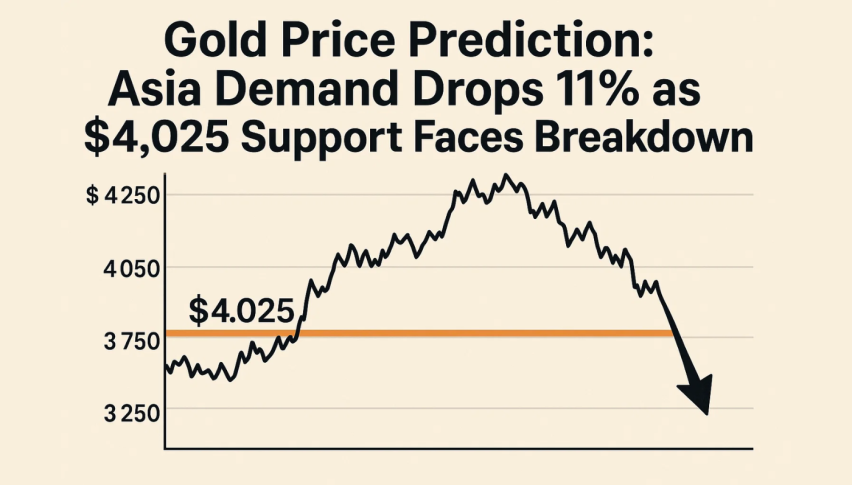
Gold Price Prediction: Asia Demand Drops 11% as $4,025 Support Faces Breakdown
Physical gold demand softened this week across major Asian hubs as rate volatility kept buyers on the sidelines.
Quick overview
- Physical gold demand has weakened in major Asian markets due to rate volatility, leading to discounts in India.
- Indian dealers are offering discounts of up to $21 per ounce as wedding-season enthusiasm cools amid high global prices.
- China's bullion market shows similar trends, with shipments falling 11% in October due to reduced demand.
- Gold prices are under technical pressure, with a potential bearish continuation if they close below $4,025.
Physical gold demand softened this week across major Asian hubs as rate volatility kept buyers on the sidelines. Indian dealers were forced to offer discounts of up to $21 per ounce, narrowing sharply from last week’s five-month high of $43. Domestic gold—trading at around ₹122,500 per 10 grams, down 4.3% week-on-week—has cooled wedding-season enthusiasm, with jewellers avoiding inventory buildup amid elevated global prices.
In India, weddings traditionally fuel strong bullion consumption, but this season’s buyers are holding back. A Mumbai bullion trader noted that families are hesitant to buy aggressively after the recent price surge.
China echoed a similar tone. Bullion traded between par to a $5/oz discount, signaling softer appetite. Swiss export data confirmed the trend: shipments fell 11% in October, reflecting pressure from high prices and shrinking Chinese demand.
Peter Fung of Wing Fung Precious Metals put it bluntly: investors still want gold, but not at these levels—“they’re waiting for a deeper correction.”
Gold Faces Technical Pressure
Gold’s chart now mirrors the slowdown in physical demand. Prices continue to hover just above $4,025, a trendline that has supported the market for weeks. But recent candles reveal indecision: small bodies, long upper wicks, and persistent failures near $4,078 suggest bulls are losing conviction.
The 20-EMA has flattened, and gold is closing below it more frequently—often a precursor to trend fatigue. On the 2-hour chart, a soft descending channel has formed, reinforced by a pattern of lower highs. Momentum confirms the cooling tone: RSI has slipped into the low-40s with no bullish divergence, meaning buyers lack the signal needed to step in confidently.
A break below $4,025 would expose $4,003, followed by the deeper support at $3,965.
Gold (XAU/USD) Trade Outlook and Key Levels
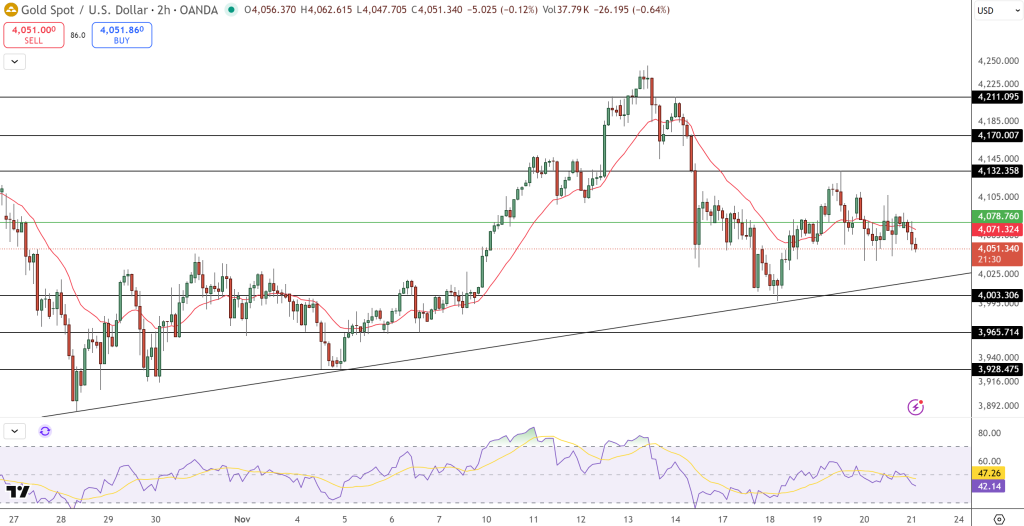
For newer traders, clarity matters more than early guesses. A clean bearish continuation forms only if gold closes below $4,025 with a strong candle—preferably a long-bodied break or a bearish engulfing pattern. That opens the path to $4,003 and potentially $3,965.
A bullish scenario demands evidence: gold needs a hammer or bullish engulfing candle plus a reclaim of the 20-EMA, which would allow a recovery toward $4,132.
Until price proves otherwise, momentum leans to the downside.
- Check out our free forex signals
- Follow the top economic events on FX Leaders economic calendar
- Trade better, discover more Forex Trading Strategies
- Open a FREE Trading Account
- Read our latest reviews on: Avatrade, Exness, HFM and XM
Related Articles


Sidebar rates
Related Posts
