Why Netflix (NFLX) Shares May Fall Another 15% From Here

Quick overview
- Netflix shares have declined over 22.6% in the past six months, with technical indicators suggesting further downside may be possible.
- The stock recently reported disappointing Q3 2025 earnings, primarily due to a significant tax expense, which has added to its vulnerability.
- Currently breaking below key support levels, Netflix could face further declines towards Fibonacci support at $89 and potentially $72.3 and $60 if that fails.
- Despite maintaining some bullish signals on longer timeframes, momentum indicators are predominantly bearish, indicating a challenging outlook for the stock.
Netflix shares have been under significant pressure over the past six months, shedding more than 22.6% as sellers steadily regained control. Despite the depth of the decline, the technical and fundamental landscape suggests the stock may not have found a floor yet.
The latest blow came in Q3 2025, when Netflix reported EPS of $5.87, falling well short of market expectations. The earnings miss was primarily driven by an unexpected $619 million tax expense tied to a long-standing dispute in Brazil, which materially distorted the quarter’s profitability. This combination of sustained technical weakness and a notable fundamental setback leaves the stock vulnerable to further downside momentum.
Netflix Stock (NFLX) Could See a Further 15% Downside
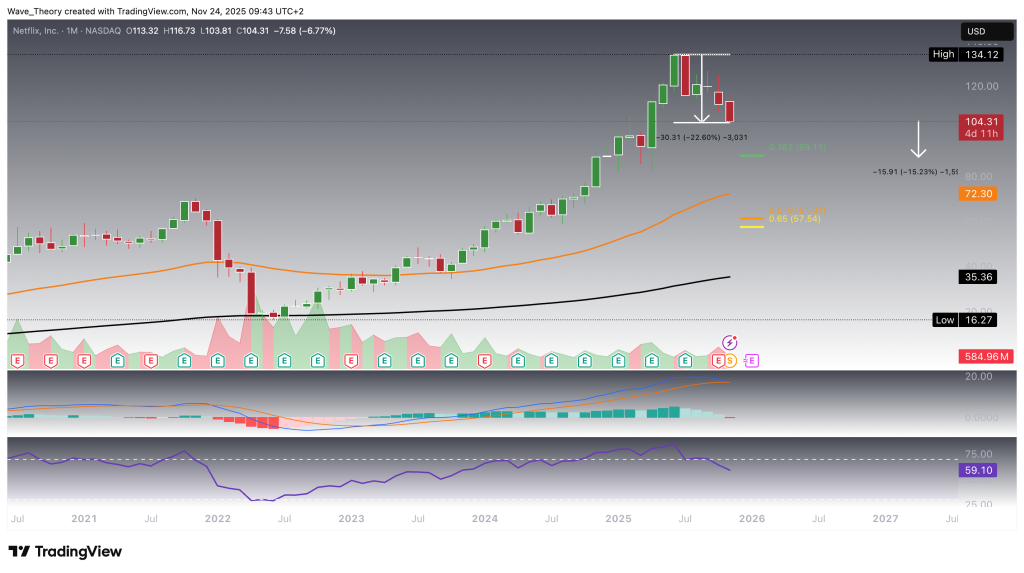
Even after a sharp 22.6% decline, Netflix may still have room to fall. A continued correction of roughly 15% would bring the stock into alignment with the significant 0.382 Fibonacci retracement level at $89, where a bullish reaction becomes likely. If that level fails to hold, the next major downside target is the 50-month EMA at $72.3. A break below that would expose the golden ratio support at $60, which represents the final major structural support on the long-term chart.
From an indicator perspective, the monthly chart presents mixed signals. The EMAs continue to maintain a golden crossover, keeping the long-term trend technically intact. However, the MACD lines have crossed bearishly, and the MACD histogram has been ticking lower for many consecutive months, reflecting persistent momentum loss. Meanwhile, the RSI remains in neutral territory, offering no immediate directional bias.
Overall, while the broader trend is still technically bullish, momentum clearly favors the bears — and Netflix may need to test deeper support levels before establishing a durable bottom.
Netflix
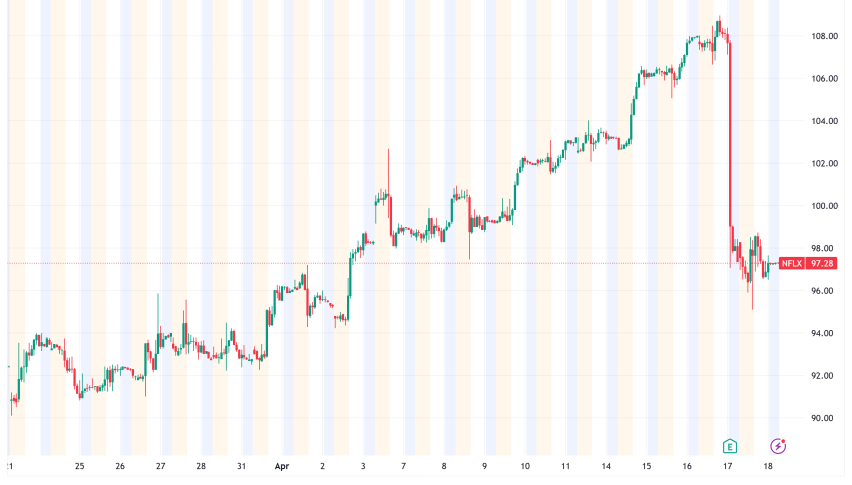
Netflix Seems to Break the 50-Week EMA Support Bearishly
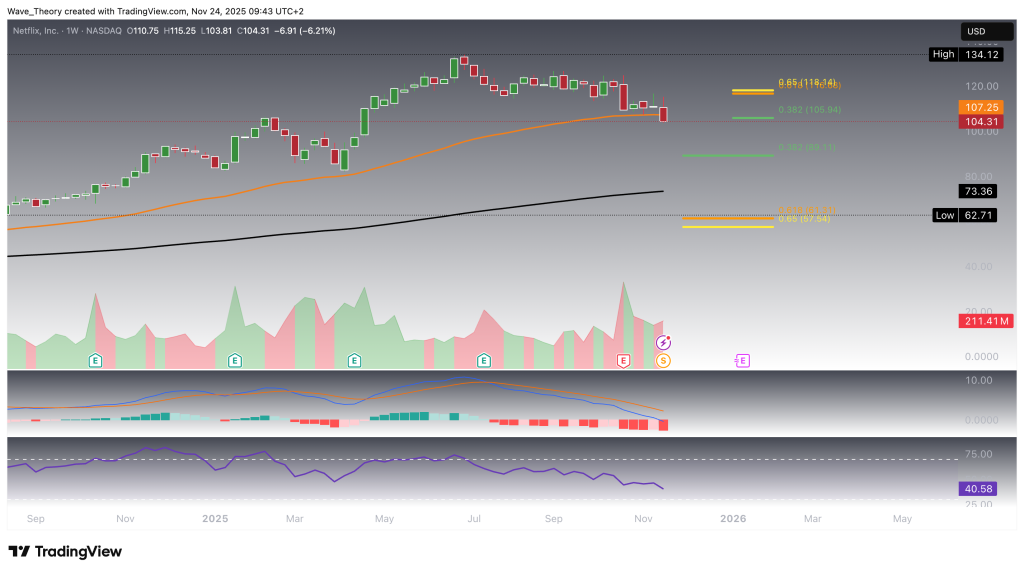
Netflix currently appears to be breaking below the 50-week EMA at $107.25, a key trend-support level. A confirmed breakdown could drag the stock further toward the next major Fibonacci support at $89.
While the EMAs still display a golden crossover, keeping the mid-term trend technically bullish, momentum indicators show clear bearish pressure. The MACD lines are bearishly crossed, and the MACD histogram has begun ticking lower again this week, indicating renewed downside momentum. Meanwhile, the RSI remains in neutral territory, offering no countertrend signal.
If Netflix manages to bounce bullishly from the 0.382 Fib support at $89, the stock could target the next major Fib resistances at $106 and $118.
Netflix Faced Rejection at the 50-Day EMA Resistance
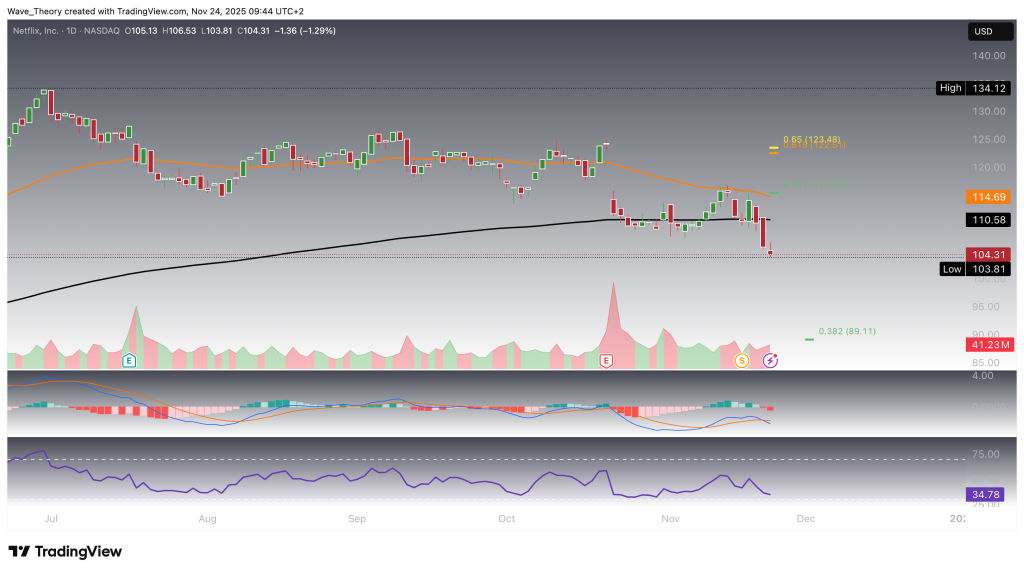
A few days ago, Netflix was rejected at the 50-day EMA resistance at $114.7, triggering renewed downside pressure. From there, the stock broke below the 200-day EMA at $110.6, confirming a bearish shift in near-term momentum.
Despite this weakness, the daily EMAs still maintain a golden crossover, which technically keeps the short- to medium-term trend bullish. However, momentum indicators lean bearish: the MACD lines have crossed down, and the MACD histogram continues to tick lower, signaling strengthening downside momentum. Meanwhile, the RSI remains neutral, providing no clear directional signal.
Should Netflix attempt an unexpected upward move, the stock faces strong Fibonacci resistance at $115 and $123. Only a decisive breakout above the golden ratio at $123 would invalidate the current correction phase and re-establish a bullish structure.
Death Cross on the 4H Chart
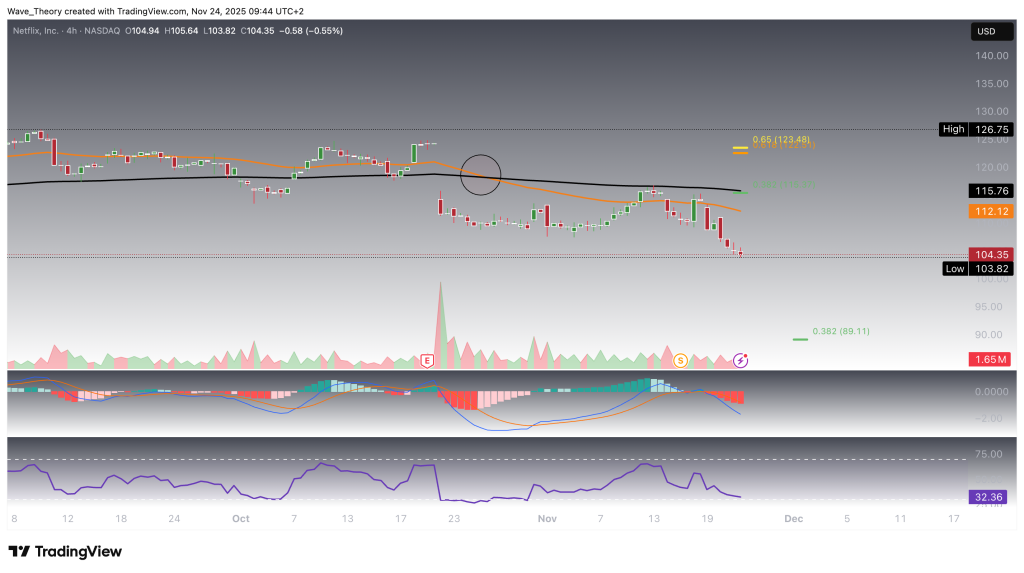
On the 4H chart, the EMAs have formed a death cross, confirming the short-term trend as bearish. In addition, the MACD lines are bearishly crossed, and the MACD histogram has been ticking lower, signaling persistent downside momentum. Meanwhile, the RSI remains in neutral territory, offering no countertrend signal.
Overall, the 4H indicators present a decisively bearish outlook, with momentum and trend structure both favoring further downside in the short term.
Summary
Netflix has dropped more than 22.6% over the past six months and technicals suggest the correction may not be over. The stock is currently breaking below the 50-week EMA at $107.25, exposing downside toward the major 0.382 Fibonacci support at $89. A failure there would open the path toward the 50-month EMA at $72.3, and ultimately the golden ratio support at $60.
On the daily chart, Netflix was rejected at the 50-day EMA at $114.7 and subsequently broke the 200-day EMA at $110.6. The EMAs maintain golden crossovers on higher timeframes, but momentum indicators lean bearish across the board: MACD lines are bearishly crossed on weekly, daily, and 4H charts, and the MACD histogram is consistently ticking lower.
If Netflix stages a bullish reaction at support, the nearest resistance levels sit at $106, $115, $118, and the key golden ratio at $123, which must be broken to end the correction. In the short term, the 4H chart confirms a death cross and broad bearish momentum.
Overall, Netflix remains vulnerable to further downside unless it can hold $89 and reclaim resistance levels up to $123.
- Check out our free forex signals
- Follow the top economic events on FX Leaders economic calendar
- Trade better, discover more Forex Trading Strategies
- Open a FREE Trading Account
- Read our latest reviews on: Avatrade, Exness, HFM and XM
Related Articles

Sidebar rates
Related Posts
