Ethereum Reclaims $3,000 Threshold, Technical Indicators Signal Potential Breakout to $9,000
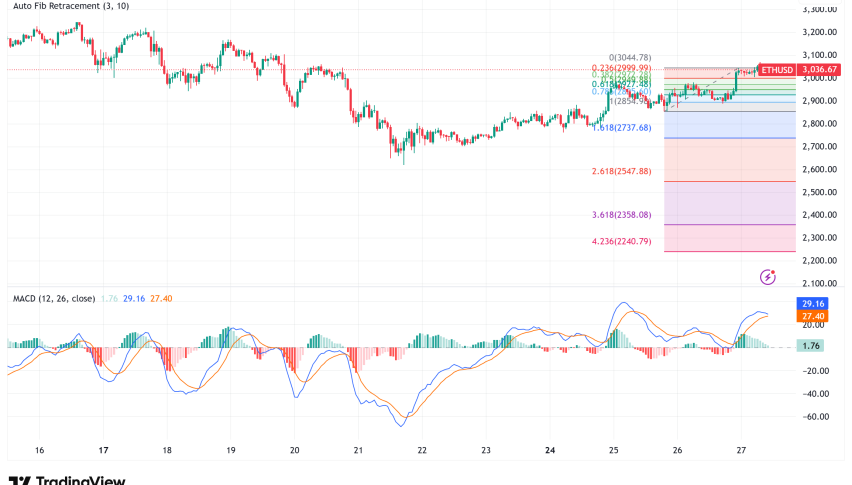
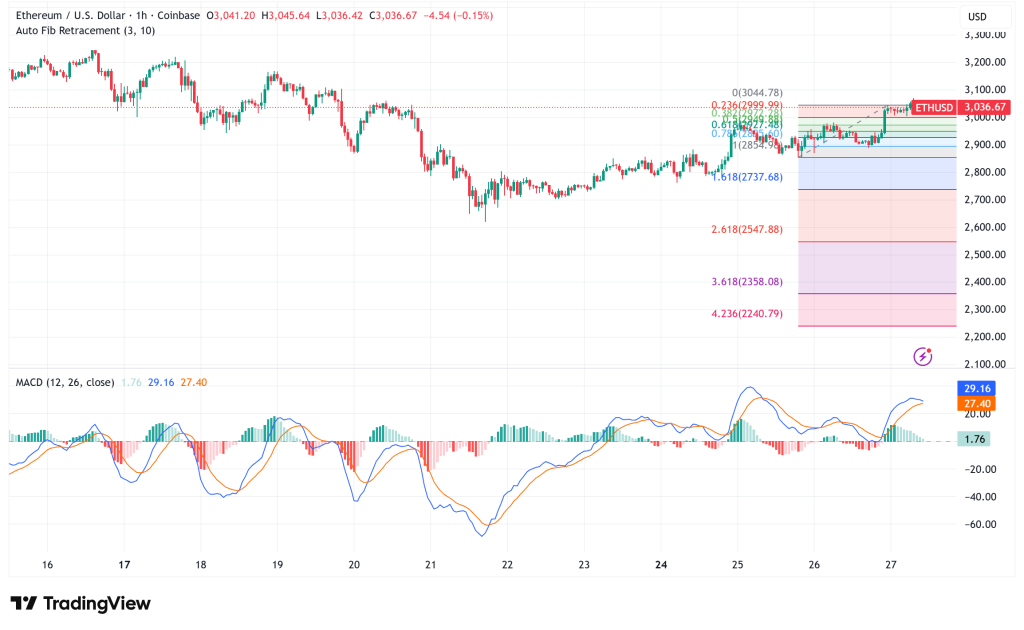
Ethereum has successfully gotten back to the $3,000 mark, which is crucial for the mind. It is now trading at about $3,041, which is a 3.7%
Quick overview
- Ethereum has regained the $3,000 mark, currently trading at approximately $3,041, reflecting a 3.7% increase in the last 24 hours.
- Technical indicators suggest bullish momentum, with resistance levels at $3,120, $3,150, and $3,165, while support is noted at $2,880.
- Institutional interest in Ethereum is rising, highlighted by significant inflows into Ethereum ETFs, particularly from BlackRock.
- Valuation models indicate Ethereum is currently undervalued, with potential price targets ranging from $4,747 to as high as $9,583.
Ethereum ETH/USD has successfully gotten back to the $3,000 mark, which is crucial for the mind. It is now trading at about $3,041, which is a 3.7% gain in the last 24 hours. This comeback comes after weeks of consolidation and is a big test for the second-largest cryptocurrency, which is still 38.8% behind its all-time high of $4,946.
ETH/USD Technical Analysis Points to Bullish Momentum Building
Ethereum has broken through several resistance levels in the past few days, rising over the $2,880 and $2,950 zones and then going back to $3,000. The cryptocurrency is presently trading above both the 76.4% Fibonacci retracement level from its previous swing high of $3,165 to the $2,620 low and the 100-hourly Simple Moving Average.
On the hourly chart, a crucial bullish trend line has developed with support at $2,880. The MACD indicator shows that the bullish zone is gaining strength, and the RSI has risen over the important 50 mark. These technical indicators show that the recovery wave has real strength behind it.
The first level of resistance is at $3,120, and the next two levels are at $3,150 and $3,165. If the price breaks above $3,165, it might go to $3,220 and maybe even $3,320 or $3,350 in the near future. But if it doesn’t break through $3,150, it could go back down to support levels of $2,980 and $2,920.
Institutional Capital Floods Into Ethereum ETFs
The most important thing that has changed to support Ethereum’s bullish thesis is the big change in how institutions feel about it. On November 24, U.S. spot Ethereum ETFs saw net inflows of $92.28 million, ending a 10-day skid of outflows. BlackRock’s ETHA fund brought in the most fresh money, $88.22 million, which shows that big banks are starting to trust the market again.
This is very different from the $261.59 million that was taken out on November 20, which shows how quickly institutional sentiment can change. Grayscale’s Mini ETH fund pulled in $9.81 million, and 21Shares’ CETH brought in $740,000. This shows that traditional finance players are becoming more interested, but only in certain funds.
BlackRock’s power goes beyond ETF inflows. The asset management behemoth has filed for a staked Ethereum ETF in Delaware. This might lead to a low-cost, yield-generating product that could change the way digital asset treasury systems compete with each other.
Valuation Models Suggest Significant Upside Potential
Simon Kim, who started the venture capital firm Hashed, just released a real-time valuation dashboard that says Ethereum’s fair value is $4,747. This means that the cryptocurrency is currently 56.9% undervalued. The dashboard uses eight different valuation models that mix standard financial measures with analysis that is intrinsic to bitcoin.
Based on Metcalfe’s Law, which values networks based on the square of their user base, the most bullish estimate puts Ethereum’s fair value at $9,583, which means it is 217% undervalued. The Discounted Cash Flow model that uses staking yields comes up with $9,067, which means it is 200% undervalued. Technical analysts have noticed that Ethereum has been “coiling” since 2021, with long periods of consolidation sometimes coming before big price increases. These bold estimates fit with that.
ETH’s On-Chain Metrics Signal Accumulation Phase
The MVRV Z-Score for Ethereum has plummeted to 0.29, which is a level that has historically come before good buying chances. This indicator, which shows how investors feel about realized value, has been negative since 2016 throughout periods of accumulation that eventually resulted to big price increases.
Notably, whale addresses that own more than 10,000 ETH have been growing, even if retail investors have been cutting back on their investment. When institutional and individual investors act differently, it frequently means that smart investors are getting ready for a future rally.
Ethereum Price Prediction: Multiple Paths Forward
Ethereum looks like it could break out based on the technical setup and fundamental changes. In the base assumption, ETH will test resistance between $3,150 and $3,165 in the next several days. If prices break above this area, they might quickly rise to $3,320–$3,350.
The more ambitious scenario, which is backed up by valuation models and the historical “coiling” trend, aims for a range of $8,500 to $9,000. But for this to happen, institutions would probably need to keep buying, there would need to be clear rules on staking products, and the whole cryptocurrency market would need to go up.
If Ethereum doesn’t stay above $3,000, it might have to test support again at $2,920, and if it goes down even more, it could go down to $2,800-$2,750. $2,980 is still the most important support level to watch because it is the first line of defense for bulls.
- Check out our free forex signals
- Follow the top economic events on FX Leaders economic calendar
- Trade better, discover more Forex Trading Strategies
- Open a FREE Trading Account
- Read our latest reviews on: Avatrade, Exness, HFM and XM
Related Articles


Sidebar rates
Related Posts
