Oracle Stock Down 46%: Can ORCL Recover? Critical Support Levels Ahead

Quick overview
- Oracle (ORCL) has experienced a significant 46% decline over the past three months but is showing early signs of a potential short-term reversal.
- The stock surged over 190% from April to September before entering a correction phase, currently rebounding from a key support zone.
- Resistance is strong at the 50-week EMA around $213.4, with a breakout needed to target higher Fibonacci levels at $246.85 and $290.
- Despite mixed signals across different timeframes, improving momentum suggests a possible upward move if key resistance levels are breached.
Oracle (ORCL) has plunged 46% over the past three months, putting the tech giant under heavy pressure as investor sentiment turned sharply bearish. This month, however, the stock is showing early signs of strength, bouncing from a key support zone and hinting at a potential short-term reversal. If momentum continues, ORCL could rally toward its next major Fibonacci resistance levels, where the real test of a sustained recovery begins.
Oracle Stock (ORCL) Surged By Over 190 % Since April
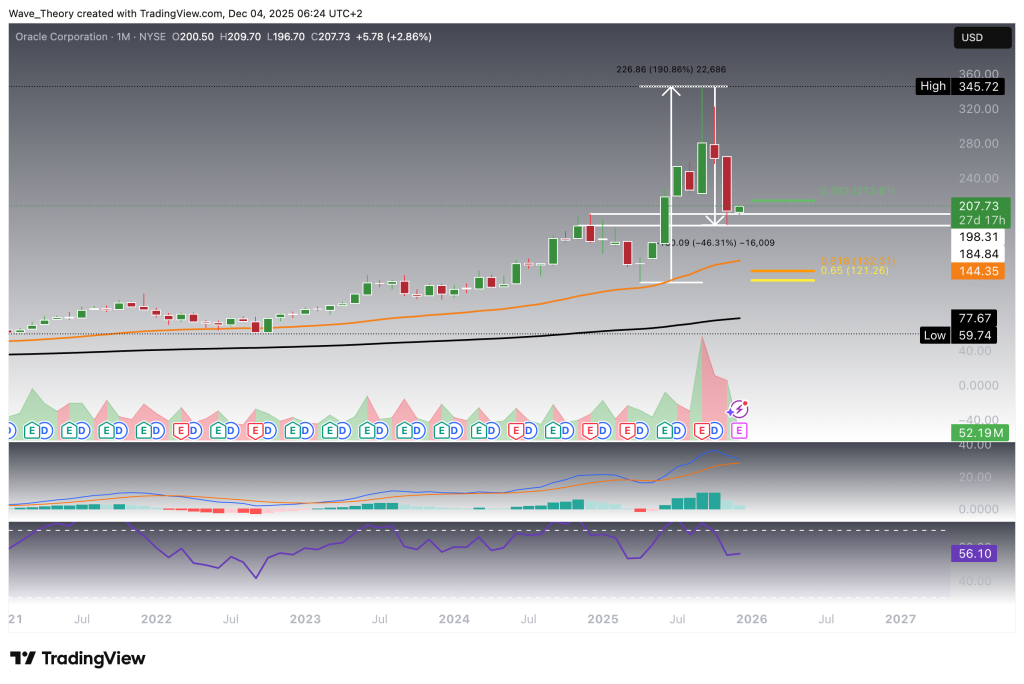
Oracle Stock (ORCL) has delivered an exceptional rally, surging more than 190% since April. From April to September, the stock advanced approximately 191% before transitioning into a pronounced correction phase. This pullback has retraced the price back into a key horizontal support zone between $185 and $198.30, where ORCL is currently showing signs of a bullish rebound.
On the monthly chart, the indicators present a mixed outlook. The EMAs remain in a golden crossover, reinforcing the broader long-term bullish trend structure. However, the MACD is flashing early caution, with the histogram having ticked bearishly since last month, and the MACD lines approaching a potential bearish cross. Meanwhile, the RSI sits in neutral territory, offering no clear directional signal at this stage.
Overall, Oracle is at a pivotal technical juncture: supported by strong long-term trend confirmation, yet facing near-term momentum risks that traders should monitor closely.
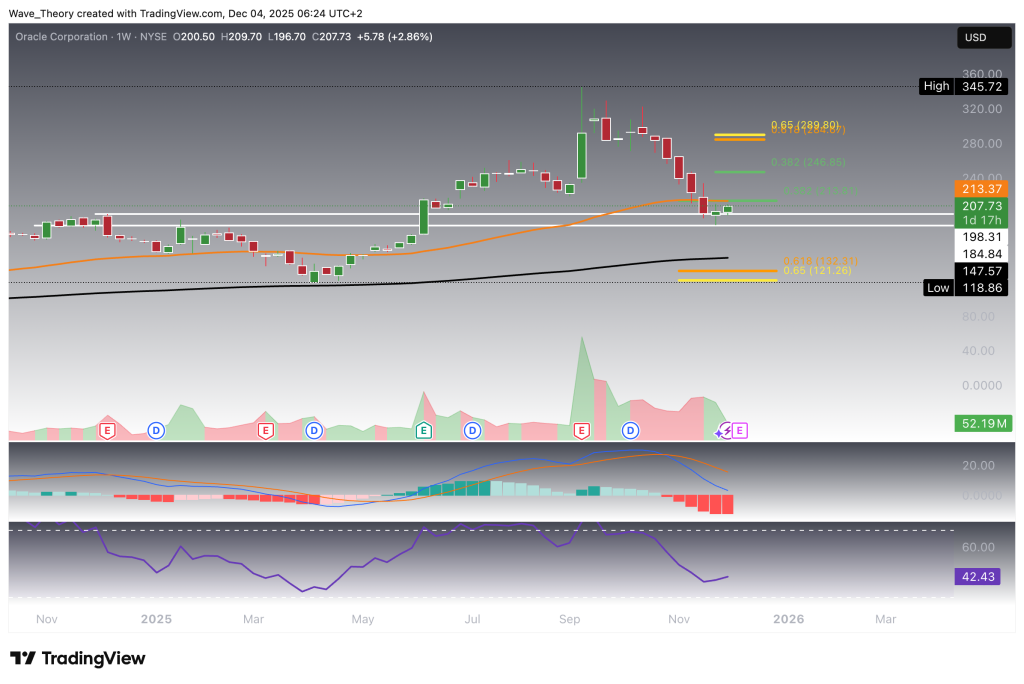
Oracle Stock Now Faces Major Resistance at the 50-Week EMA at $213.4
Oracle is currently encountering significant resistance at the 50-week EMA at $213.4. This level aligns closely with the former 0.382 Fibonacci support, which has now flipped into resistance at $213.8. A decisive breakout above this confluence zone would open the path toward the next major Fibonacci resistance levels at $246.85 and $290.
Only a confirmed break above the golden ratio at $290 would formally signal the completion of the broader correction phase. In that scenario, Oracle could retest its all-time high near $346, or potentially move beyond it.
The weekly indicators present a mixed technical picture. The EMAs remain in a golden crossover, validating the mid-term bullish trend bias. However, the MACD lines are bearishly crossed, and the histogram has been ticking lower for several consecutive weeks, signaling declining momentum. The RSI, meanwhile, sits in neutral territory and does not provide a clear directional signal.
Overall, Oracle sits at a critical technical inflection point: a breakout above $213.4–$213.8 could re-ignite bullish continuation, while continued rejection at this zone may extend the corrective structure.
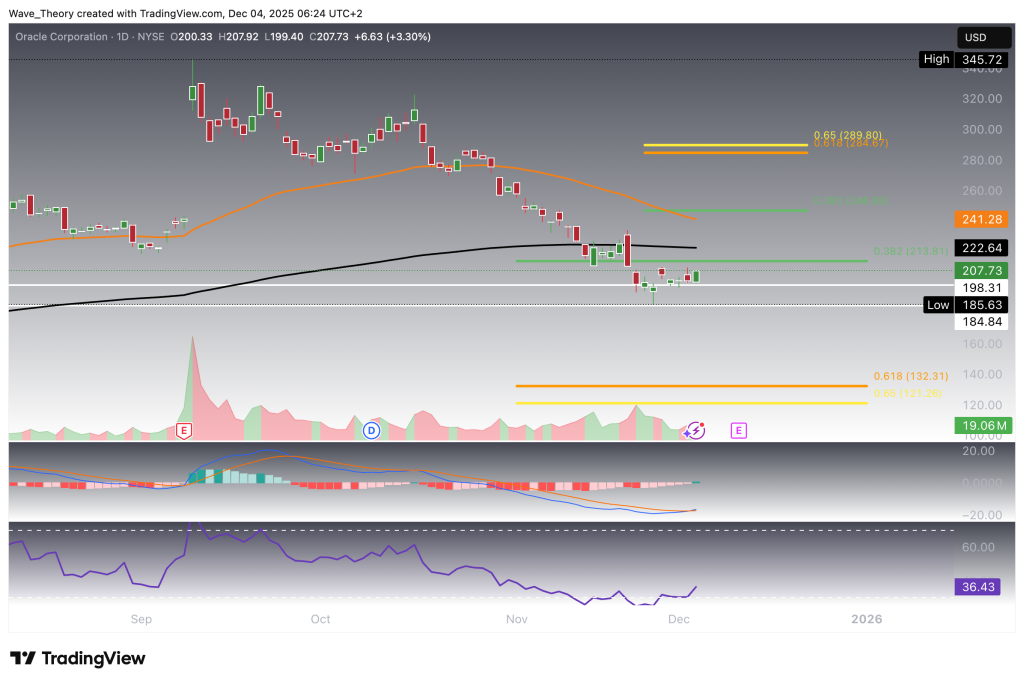
Predominantly Bullish Signals on the Daily Chart
On the daily timeframe, Oracle is beginning to show increasingly bullish momentum. The MACD lines have crossed bullishly, accompanied by a rising MACD histogram, signaling a strengthening upward shift in short-term momentum. The EMAs continue to hold a golden crossover, reinforcing a bullish trend structure in the short- to medium-term.
Meanwhile, the RSI offers no explicit bullish or bearish signal, remaining in neutral territory. Notably, however, it recently dipped into oversold regions and has since reverted to neutral, a behavior that often aligns with early-stage recovery phases.
Overall, the daily chart now leans bullish, supported by momentum and trend indicators, while remaining structurally neutral on the RSI.
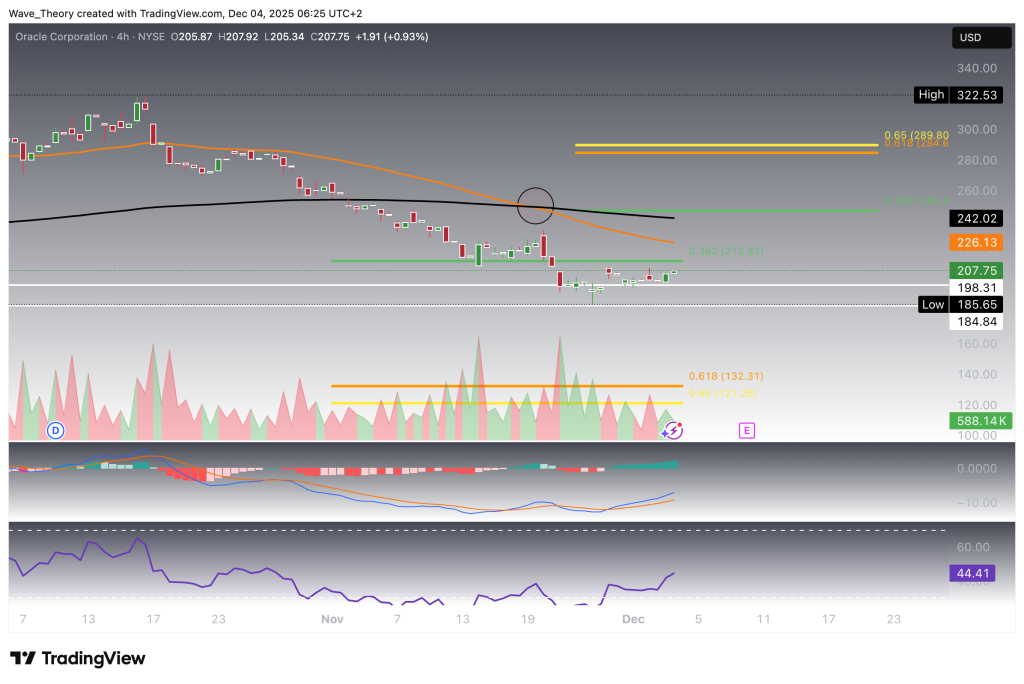
Death Cross on the 4H Chart
On the 4-hour chart, Oracle exhibits short-term bearish pressure, with the EMAs forming a death cross, confirming a downward trend in this lower time frame. However, the momentum picture contrasts with the EMA structure. The MACD lines are bullishly crossed, and the MACD histogram continues to build a strong upward trend, indicating growing bullish momentum beneath the surface. The RSI remains in neutral territory, offering no immediate directional bias.
Given this mix of signals, the short-term structure suggests that despite the EMA-based bearish trend, Oracle could be positioned for a short-term upward move toward the next Fibonacci resistance levels, supported by improving momentum.
Oracle Stock – Full Technical Summary & Key Levels
Oracle surged by ~191% from April to September before entering a sharp correction down into the key support zone at $185–$198.3, where it is currently showing signs of a bullish rebound.
Monthly Chart:
- Long-term trend remains bullish with a golden EMA crossover.
- Momentum is weakening: MACD histogram ticking bearish, MACD lines near a bearish cross.
- RSI neutral.
Weekly Chart:
- Major resistance sits at the 50-week EMA at $213.4, aligned with the 0.382 Fib resistance at $213.8.
- If breached, next upside targets are $246.85 and $290.
- A break above the golden ratio at $290 would confirm the end of the correction and open the path back toward the ATH at ~$346.
- Indicators mixed: EMA golden cross bullish, but MACD bearish and histogram falling; RSI neutral.
Daily Chart:
- Structure turning bullish: MACD bullish cross, histogram rising.
- EMA golden cross supports short- to medium-term upside.
- RSI neutral after recovering from recent oversold levels.
4H Chart:
- Short-term EMA structure bearish with a death cross.
- Momentum contradicts this: MACD bullish cross and a strongly rising histogram.
- RSI neutral.
Overall Outlook:
Despite mixed signals across timeframes, momentum has improved meaningfully on the lower charts. A decisive breakout above $213.4–$213.8 would confirm continuation toward $246.85, $290, and ultimately the ATH at $346.
- Check out our free forex signals
- Follow the top economic events on FX Leaders economic calendar
- Trade better, discover more Forex Trading Strategies
- Open a FREE Trading Account
- Read our latest reviews on: Avatrade, Exness, HFM and XM
Related Articles


Sidebar rates
Related Posts
