Ethereum Faces Intensifying Pressure as Network Activity Plunges to Seven-Month Lows
Ethereum (ETH) is trading at about $2,930, maintaining its position above the crucial $2,900 support level after a precipitous 24-hour drop
Quick overview
- Ethereum is currently trading at approximately $2,930, having experienced a significant drop that briefly brought it down to $2,875.
- Over $650 million in liquidations occurred in the crypto derivatives market, with Ethereum being the most affected, accounting for nearly $235 million.
- Network activity for Ethereum has declined sharply, with weekly active addresses dropping to their lowest since May 2024, indicating waning investor interest.
- Technical analysis suggests bearish momentum persists, with critical support at $2,900 and resistance levels that need to be broken for a potential price recovery.
As of this writing, Ethereum ETH/USD is trading at about $2,930, maintaining its position above the crucial $2,900 support level after a precipitous 24-hour drop that saw the second-largest cryptocurrency briefly reach $2,875. One of the biggest liquidation events in recent months has been brought on by the decline, with Ethereum unexpectedly overtaking Bitcoin as the main victim of forced position closures.
Record Liquidations Hit Ethereum Traders Hard
Over the past day, there has been a severe shakeout in the crypto derivatives market, with over $650 million in total liquidations. With almost $235 million in liquidated contracts, Ethereum was the most affected by this flush, well exceeding Bitcoin’s $186 million. Leveraged traders who were counting on higher prices were caught off guard by the abrupt decline, and long positions accounted for about 90% of all liquidations.
The severity of Ethereum’s price decrease in relation to other significant assets is reflected in the disproportionate impact on the cryptocurrency. Highly leveraged positions that had accrued during the token’s earlier consolidation period over $3,000 were notably impacted by the cascade effect of margin calls caused by ETH’s decline below the psychologically significant $3,000 mark and subsequent test of $2,875.
Ethereum Network Activity Signals Weakening Demand
Ethereum’s core measurements, which go beyond price activity, present a troubling image. In December, the number of weekly active addresses fell from 440,000 to 324,000, which is the lowest since May 2024. A considerable decrease in network involvement is shown by this 116,000-address drop, which also points to rising investor disinterest. Similar declines in transaction counts to July lows suggest that institutional and retail players are withdrawing from the network.
Selling pressure from US-based investors has increased in tandem with the decline in on-chain activity. With total net assets falling from $21.43 billion to $18.27 billion since December 10, spot Ethereum ETFs saw outflows of $224.78 million for the third day in a row. Furthermore, the Coinbase Premium Index, which gauges the price differential between Coinbase and Binance, has gone negative, indicating that US selling pressure currently controls market dynamics.
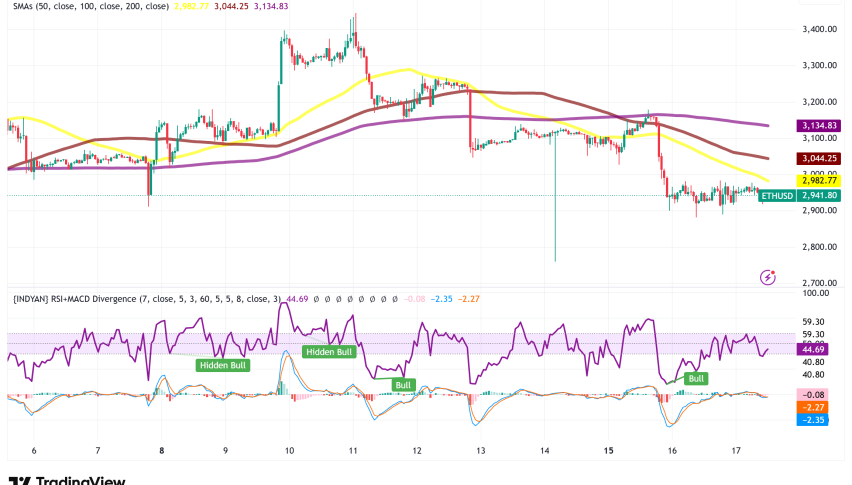
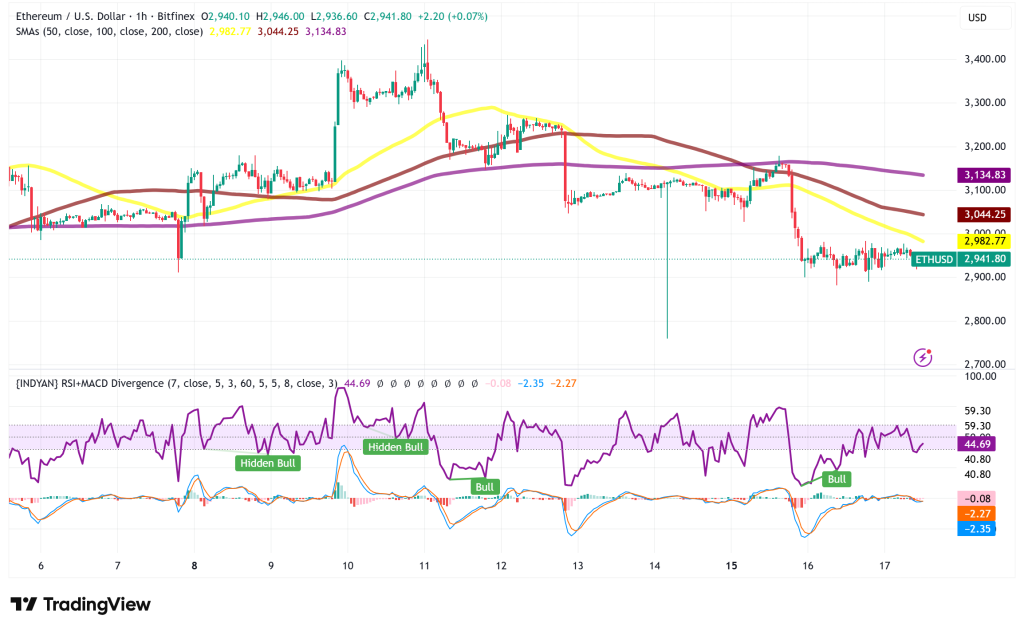
ETH/USD Technical Analysis: Bearish Momentum Persists Despite Bounce
Technically speaking, Ethereum’s price structure is still brittle. ETH has formed a negative trend line with resistance presently located at $3,110 after failing to hold above $3,050. The bearish mood is being reinforced by the cryptocurrency’s trading below both the $3,000 psychological mark and its 100-hour Simple Moving Average.
The Stochastic Oscillator has entered oversold territory, which may lead to a brief relief rebound, while the Relative Strength Index (RSI) is still declining below its neutral 50 level. The hourly MACD indicator, on the other hand, indicates that selling pressure has not yet run its course because it is showing declining momentum in the negative zone.
Ethereum Price Prediction: Critical Levels Determine Next Move
Ethereum is at a pivotal point with distinct areas of support and resistance. To invalidate the immediate bearish setup, bulls need to recover $3,025 and then break through $3,050. In the short term, a successful break of the $3,110 trend line resistance might pave the way for a rise into $3,200–$3,250, with an acceleration of momentum possibly reaching $3,470.
On the other hand, if the $2,900 support level is not maintained, there may be another leg down toward $2,840 and $2,800. The next significant support zone is located between $2,400 and $2,600. The path of least resistance seems to favor downside risks in the short term due to the current combination of bearish technical indications, weak network fundamentals, and ongoing selling pressure from the US.
- Check out our free forex signals
- Follow the top economic events on FX Leaders economic calendar
- Trade better, discover more Forex Trading Strategies
- Open a FREE Trading Account
- Read our latest reviews on: Avatrade, Exness, HFM and XM
Related Articles


Sidebar rates
Related Posts
