Gold Price Forecast: $4,550 Pullback Tests Bulls as $4,350 Becomes Line in Sand
Gold is trading near $4,365, cooling off after a sharp rejection from the $4,550 high. While the drop looks aggressive on the surface...

Quick overview
- Gold is currently trading around $4,365 after a significant drop from a high of $4,550, indicating a corrective phase rather than a trend reversal.
- The $4,350–$4,360 zone has emerged as a key demand area, with buyers showing interest in defending this level.
- Despite recent weakness, gold remains within a rising channel, suggesting a constructive medium-term bias.
- Key levels to watch include support at $4,350–$4,360, resistance at $4,400, and potential downside risk below $4,307.
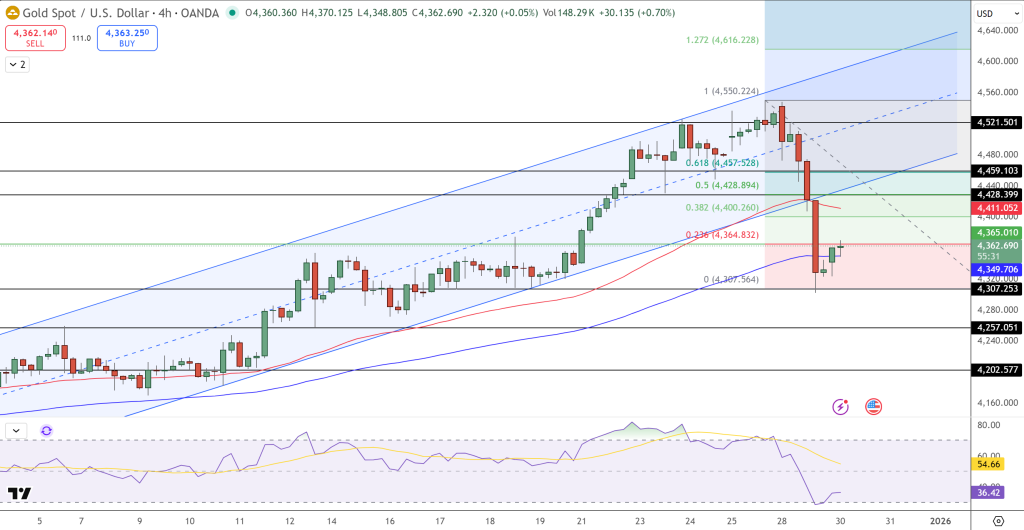
Gold is trading near $4,365, cooling off after a sharp rejection from the $4,550 high. While the drop looks aggressive on the surface, the broader structure still points to a corrective phase rather than a trend reversal. The move lower sliced cleanly through the 38.2% Fibonacci retracement at $4,400 and briefly undercut the 50% level near $4,429, before buyers stepped in close to the 61.8% retracement around $4,357.
That reaction matters. The $4,350–$4,360 zone has now emerged as a near-term demand area, where dip buyers appear more comfortable defending the trend. In simple terms, gold has pulled back sharply, but it hasn’t lost its footing.
Gold (XAU/USD) Rising Channel Still Defines the Bigger Picture
Despite recent weakness, price action remains contained within a rising channel, keeping the medium-term bias constructive. Momentum, however, has clearly slowed. The sell-off was marked by long bearish candles, followed by smaller recovery candles, a classic sign that selling pressure is easing rather than intensifying.
From a moving-average perspective, the picture remains mixed but stable:
- The 50-EMA is flattening near $4,430, acting as short-term resistance
- Price is holding just above the 100-EMA, preserving the broader structure
- No decisive breakdown below channel support has occurred
This combination suggests consolidation rather than capitulation.
Gold Technical Analysis: RSI Signals a Potential Base, Not Panic
Momentum indicators support the idea that downside risk may be moderating. The RSI dipped into the mid-30s, reflecting short-term oversold conditions, but has since begun to curl higher. That shift often signals base-building, especially when it occurs near major Fibonacci support inside an uptrend.
From here, the technical roadmap is fairly clear. A sustained move back above $4,400 would improve near-term sentiment and expose upside toward $4,480, followed by a retest of the $4,520 region. On the flip side, a clean break below $4,307 would weaken the structure and open the door toward $4,257.
Gold Outlook: Levels That Matter Now
- Key support: $4,350–$4,360
- Near-term resistance: $4,400, then $4,480
- Downside risk zone: Below $4,307 toward $4,257
Trade idea: Buy pullbacks near $4,350, targeting $4,480, with a stop below $4,300.
- Check out our free forex signals
- Follow the top economic events on FX Leaders economic calendar
- Trade better, discover more Forex Trading Strategies
- Open a FREE Trading Account
- Read our latest reviews on: Avatrade, Exness, HFM and XM
Related Articles


Sidebar rates
Related Posts
