Bitcoin Holds $88K as Options Surge and Cycle Theory Faces Historic Test
Bitcoin is trading above $88,000 as 2026 begins. It has been rather stable over the previous 24 hours, even though changes in the market
Quick overview
- Bitcoin is currently trading above $88,000, showing stability despite market structure concerns.
- The Bitcoin options market has seen significant growth, particularly due to BlackRock's iShares Bitcoin ETF, which has increased its open interest dramatically.
- On-chain analytics indicate potential bearish signals, with the Apparent Demand indicator turning negative on a 30-day basis, suggesting weakening demand.
- Technical indicators hint at a possible price breakout towards $90,000, but medium-term outlook remains uncertain due to conflicting demand fundamentals.
Bitcoin BTC/USD is trading above $88,000 as 2026 begins. It has been rather stable over the previous 24 hours, even though changes in the market structure raise worries about where the cryptocurrency will go in the near future. The asset started the new year around $87,500, which was a quiet start after a terrible fourth quarter in which BTC couldn’t stay above $110,000 even though a lot of institutions and businesses were buying it.
Options Market Dynamics Reshape Bitcoin Trading Landscape
The Bitcoin options market has grown a lot. The total amount of open interest went from $39 billion in December 2024 to $49 billion in December 2025. A lot of this growth is because of BlackRock’s iShares Bitcoin ETF (IBIT), whose options open interest went from $12 billion to $40 billion in the same time frame.
This huge increase in options activity shows that institutional investors are changing their strategy after the cash-and-carry trade, which used to be very profitable, fell apart. This approach earned traders annualized premiums of 10–15% through the end of 2024, but by November 2025, those profits had dropped to less than 5%. Funds moved into covered call strategies that offered 12–18% annualized yields in search of other options.
Critics say that these covered calls make prices go up too much because investors are “renting out” their upside potential. When people sell covered calls, they give buyers the opportunity to acquire Bitcoin at set strike prices, such $100,000. This lets them make money while limiting their own gains. Professional dealers who are hedging these positions often sell spot Bitcoin, which could provide long-term resistance at popular strike levels.
But evidence from the market goes against this story of censorship. The put-to-call ratio for IBIT has been below 60%, which means that there isn’t a lot of call selling going on. This ratio would have fallen apart if covered calls had really taken over. Put options are also trading at a 5% premium right now, compared to a 2% discount in late 2024. This shows that there is a lot of hedging demand along with yield schemes.
Demand Metrics Flash Warning Signs for Bitcoin Bulls
On-chain analytics show worrying patterns under Bitcoin’s consistent price movement. The Apparent Demand indicator from CryptoQuant, which looks at how much miners are making each day compared to how much supply is sitting around for a year, has turned negative on the 30-day time frame. In the past, Bitcoin cycles have gone into bear markets when this indicator went below zero on both the monthly and yearly periods.
The yearly Apparent Demand is still positive, but it is going down faster. Past cycles show that this metric’s steady decline usually comes before a long period of poor prices. Adding to these worries, US Bitcoin spot ETFs have had negative netflows for the last 30 days, which shows that demand is low in both on-chain and off-chain markets.
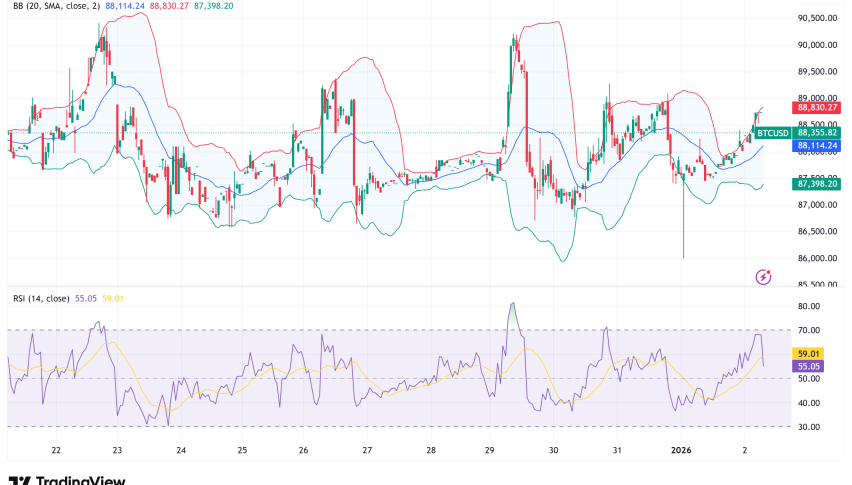
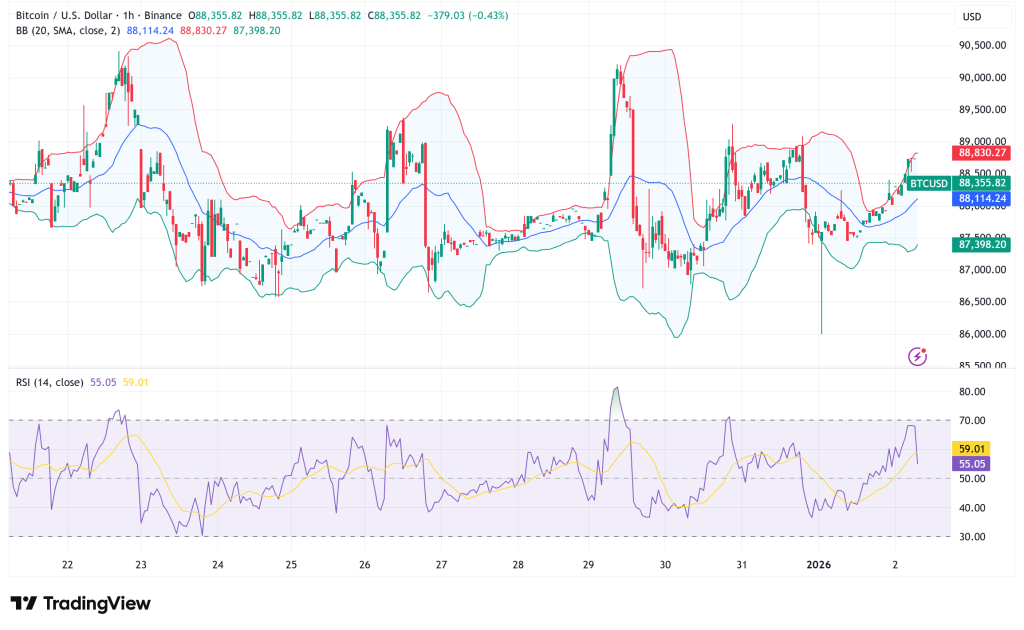
BTC/USD Technical Setup Points to Imminent Volatility Breakout
Even though there are worries about demand, technical signs show that a big price change is coming. The weekly RSI is below 40, and the daily Bollinger Band Width has shrunk to levels not seen since January 2023, just before Bitcoin’s rise from $16,000 to over $70,000. A three-day positive divergence on the RSI has developed right above important support levels, giving bulls hope for a rally in the first quarter.
Bitcoin Price Outlook: Cautious Optimism Amid Structural Uncertainty
In the next few months (1 to 3): Technical indicators point to a move toward $90,000, and if momentum grows, it might test historical highs. Historically, when the Bollinger Bands are close together and the RSI is low, it means that the market is about to become quite volatile. $87,500 is the first level of support, and $90,000 and $95,000 are the first levels of opposition.
The picture gets less clear in the medium term (6–12 months). Weakening demand fundamentals are at odds with bullish technical setups and ongoing institutional interest. Bitcoin could be under pressure for a long time if yearly Apparent Demand goes negative. On the other hand, a rise in demand may lead to rallies toward $110,000 to $150,000, with many analysts, including Strategy CEO Michael Saylor, aiming for the top end of that range.
The options market is probably a symptom of Bitcoin’s current concentration, not the cause. Lower implied volatility, which is now 45% instead of 57% in late 2024, has lowered covered call premiums, which weakens any purported suppressive effect. The options market has become the main place to make money off of Bitcoin’s price swings, rather than limiting prices.
Bitcoin’s Four-Year Cycle Theory Faces Existential Challenge
Bitcoin’s performance in 2025 was unusual in that it closed as the first “red” yearly candle in a year after the halving. This change has made the discussion over whether Bitcoin’s well-known four-year cycles are still useful even stronger. Simon Dixon, the CEO of Bnk To The Future, said that the pattern is dead and that 2026 will be a “new era” for how Bitcoin prices move.
- Check out our free forex signals
- Follow the top economic events on FX Leaders economic calendar
- Trade better, discover more Forex Trading Strategies
- Open a FREE Trading Account
- Read our latest reviews on: Avatrade, Exness, HFM and XM
Related Articles


Sidebar rates
Related Posts
