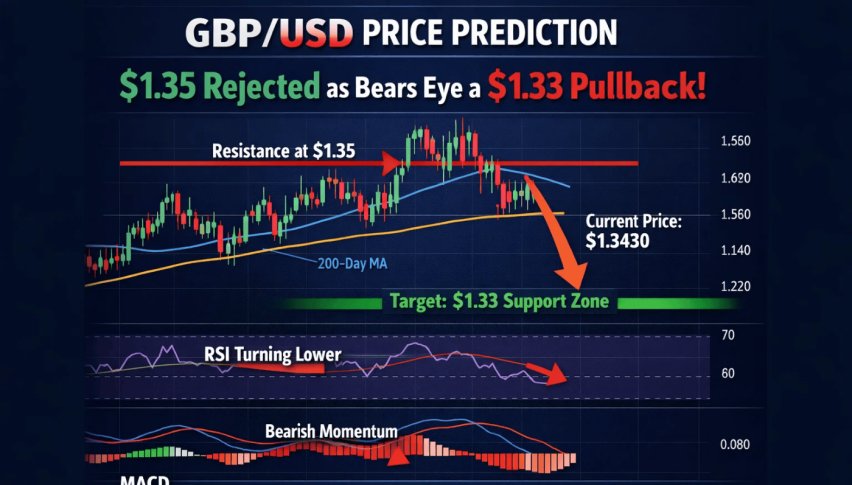
GBP/USD Price Prediction: $1.35 Rejected as Bears Eye a $1.33 Pullback
The British pound begins 2026 on a wobbly footing against the US dollar. On the latest 4-hour sessions, the GBP/USD price dropped...
Quick overview
- The British pound starts 2026 weak against the US dollar, with GBP/USD dropping towards $1.3450 after failing to maintain gains above $1.3530.
- Despite a positive overall trend, recent price action indicates waning buying enthusiasm and potential consolidation after significant gains in late 2022.
- GBP/USD is testing critical support at $1.3430, with potential downside targets at $1.3365 and $1.3285 if this support fails.
- Short-term momentum appears limited, and a trade idea suggests selling on a confirmed break below $1.3430 with a target of $1.3365.
The British pound begins 2026 on a wobbly footing against the US dollar. On the latest 4-hour sessions, the GBP/USD price dropped back down towards $1.3450 after GBP/USD struggled to hold its gains above the $1.3530 resistance level – a hurdle which had blocked several earlier upswings right back in December.
While the overall trend is still positive, the way the price has performed of late paints a more cautious picture. Candles near the highs are showing smaller bodies and keep getting knocked back by selling pressure, or upper wicks.
That’s a clear indication that buying enthusiasm is running out of steam rather than building up. Instead of winning more ground, rallies are met with a fresh supply of sellers, a warning sign that the pair may be entering a consolidation phase after its significant gains in November and December.
Rising Channel Still Looks Healthy, But Now The Markets Are Testing Key Support
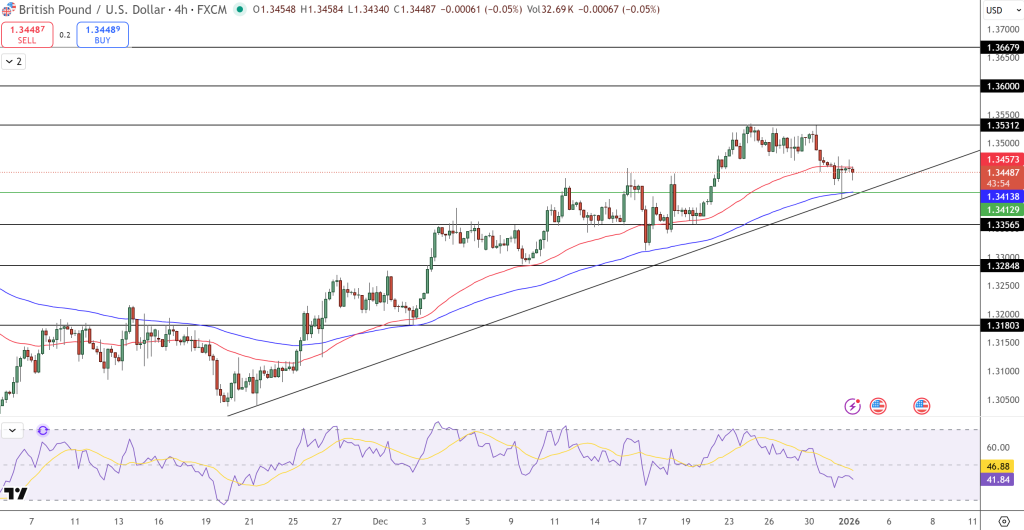
Technically, GBP/USD is still within a healthy rising channel that’s been pushing the price upwards since late November. However, the pair is now coming up against a really important support cluster.
The price is hovering just above the key ascending trendline and the 50-day EMA at $1.3430 – an area which has reliably acted as a security blanket during earlier pullbacks. That level now represents a critical test point for short-term direction.
If That Support Fails, Things Get Interesting
If that support does give way, then we can see some of the following levels coming into focus:
- $1.3365 – an area that was a previous consolidation zone
- 38.2% Fibonacci retracement of the recent price surge
- $1.3285 – which lines up with the 50% Fibonacci level
Despite near-term pressure, the 100-day EMA is still pointing upwards, suggesting the overall bullish trend remains intact.
RSI Drops As The Market Takes A Breath
Momentum indicators are reflecting a more subdued market tone. RSI has slipped back towards 42, which is a sign that upside momentum is losing steam – but hasn’t yet reached the point where it’s getting desperate.
Plus, on the chart, there’s no clear bearish reversal pattern in sight.
Instead, the way the price is behaving suggests that the market is just pausing to catch its breath after a big run-up, and waiting for something new to prompt the next trend leg.
GBP/USD Short-Term Outlook: Consolidation Or Deeper Pullback Next
As long as GBP/USD stays above $1.3430, the big-picture trend remains healthy. But short term, it’s looking a bit wobbly & upside momentum looks limited. If GBP/USD breaks below that level, we’ll be taking a closer look at $1.3365 and $1.3285 if the selling intensifies.
Trade idea: Sell on a confirmed break below $1.3430, target $1.3365, stop loss above $1.3500.
- Check out our free forex signals
- Follow the top economic events on FX Leaders economic calendar
- Trade better, discover more Forex Trading Strategies
- Open a FREE Trading Account
- Read our latest reviews on: Avatrade, Exness, HFM and XM
Related Articles


Sidebar rates
Related Posts
