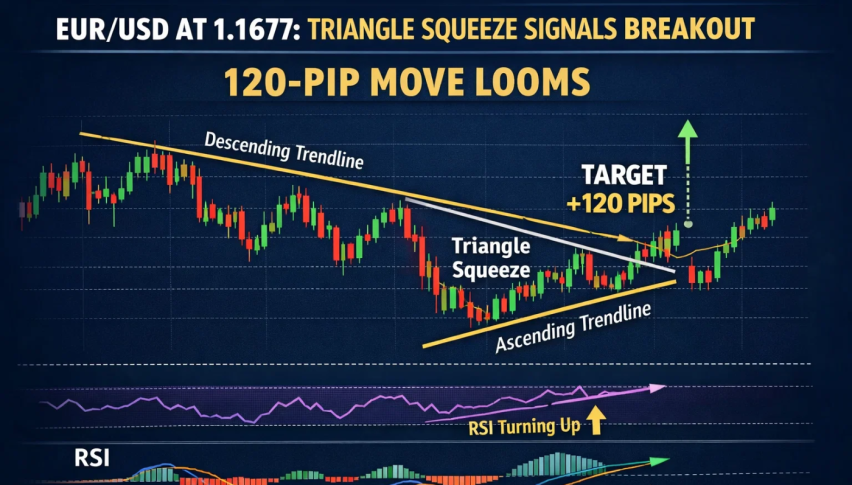
EUR/USD at 1.1677: Triangle Squeeze Signals Breakout as 120-Pip Move Looms
The EUR/USD pair is hovering at 1.1677, holding up following its retreat from a late-December peak of 1.1805...
Quick overview
- The EUR/USD pair is currently at 1.1677, showing signs of consolidation after retreating from a December peak of 1.1805.
- The price action indicates a standoff between buyers and sellers, with the market coiled in a short-term triangle that may signal an upcoming expansion.
- Key technical levels include support at 1.1670-1.1659 and a potential downside risk if the price breaks below 1.1660.
- Traders should monitor for a confirmed break in either direction, as it could lead to increased volatility and significant price movement.
The EUR/USD pair is hovering at 1.1677, holding up following its retreat from a late-December peak of 1.1805. Rather than a sharp about-face, the price action suggests the market is just catching its breath for the moment. The pullback has been orderly so far, with volatility generally subsiding as traders wait for a clearer sign on which way to bet.
On the four-hour chart, EUR/USD has shifted from trending behaviour into limbo -for the moment. Buyers who chased the December rally have backed off a bit, while sellers are cautious about putting in new short positions given the proximity to that key support zone. This standoff is exactly reflected in the current price structure.
EUR/USD Technical Analysis: The Triangle Tightening up
Technically, EUR/USD is currently coiled inside a short-term triangle, formed by a trendline running diagonally down from those recent highs and a rising trend from way back in December. This sort of triangle often signals an upcoming expansion, especially as the price approaches the point where the two lines meet.
Recent candlesticks really tell the story. They come with small bodies but longer wicks at the top and bottom around the 1.1660 – 1.1680 zone, which really shows up the indecision. Neither side has been able to force a decisive close, which suggests the next move may be pretty sharp once direction is chosen.
Some of the key technical landmarks currently in play are:
- Support zone: 1.1670 – 1.1659, which also happens to be in line with prior price structure
- Fibonacci level: 38.2% retracement of the last bit of an upswing
- Downside risk: a break below which opens room towards 1.1622
Momentum Fades, But Pressure Builds Up
The momentum indicators are all in line with the price action. RSI is sitting around the low 40s, suggesting sellers have the upper hand for now but not enough conviction to push the price lower.

Importantly, this setup shows consolidation within a broader corrective phase rather than a case of sellers panicking. If support continues to attract bids though, the price will rebound towards 1.1743. However, repeated testing of the same support area can weaken it over time.
What Traders Should Keep an Eye on Next
As that triangle tightens, traders should focus less on predicting what happens next and more on how the price reacts. A confirmed break is likely to bring the followers as sidelined participants get back in.
Some of the key things to watch out for include:
- A clean break below 1.1660 could accelerate losses down towards 1.1585
- A rebound above 1.1743 would signal a bit of short-term relief for the euro
- Continued compression increases the odds of a pretty sharp expansion in volatility
Trade idea: Sell below 1.1660, target 1.1585, stop loss above 1.1725.
- Check out our free forex signals
- Follow the top economic events on FX Leaders economic calendar
- Trade better, discover more Forex Trading Strategies
- Open a FREE Trading Account
- Read our latest reviews on: Avatrade, Exness, HFM and XM
Related Articles


Sidebar rates
Related Posts
