WTI Crude Slides 4% to $59.50 as Iran Risk Fades and U.S. Stocks Surge
Oil prices did a sharp about face on Thursday, with WTI crude plummeting towards $59.50 as the geopolitical risk premiums began...
Quick overview
- Oil prices saw a significant drop, with WTI crude nearing $59.50 as geopolitical risk premiums eased and supply data negatively impacted sentiment.
- Brent crude's earlier gains were wiped out as traders reassessed the risk outlook following comments from President Trump regarding US military actions in Iran.
- Venezuela's increase in oil production and exports added pressure to the market, coinciding with a notable rise in US crude inventories.
- Despite a surge in China's crude imports, concerns remain about demand's ability to keep pace with rising supply in the short term.
Oil prices did a sharp about face on Thursday, with WTI crude plummeting towards $59.50 as the geopolitical risk premiums began to ease off and fresh supply data put the kibosh on sentiment. This about face followed comments from President Donald Trump that suggested killings of demonstrators in Iran are winding down and, most importantly, that theres not going to be an immediate US military escalation that could mess up energy supplies in the Middle East.
Brent crude had been heading up towards $66.50 per barrel earlier in the day but by and large most of those gains got wiped out when traders started re-evaluating the near-term risk outlook. Saxo Bank analyst Ole Hansen reckons that the market pretty quickly factored out the immediate danger that the US would be taking action against Iran even if a broader geopolitical uncertainty still lingers. The result was a swift unwinding of long positions that had been driven by risk factors.
Geopolitics Ease Off but Uncertainty Still a Big Wildcard
The tensions between the US and Iran mean that they’re still a huge wild card for the oil markets, even if immediate fears and worries have eased off a bit. Although Washington has started pulling some personnel out of military bases in the region, Iran has warned its neighbours not to get involved if the US does decide to strike. This delicate balance has taken the edge off the risk premium but hasn’t entirely taken it away.
Also, while all this was playing out, other developments on the supply side added to the pressure:
- Venezuela has started reversing some of the oil cuts they made under US sanctions – it looks like the country is starting to ramp up production again.
- According to multiple sources, the country is once more exporting crude at a decent level.
- And this adds more supply into the market at a time when inventories are already going up.
On the demand side, OPEC put a more positive spin on thing when they said that 2027 oil demand is going to grow at a similar rate to this year. They also said that they think there will be a near balance between supply and demand in 2026 – that’s a pretty big change to what some other groups were saying.
US Inventories and China Data Shift the Focus
The main drag on prices came from the US inventory situation – the Energy Information Administration said that weekly crude stock build was the biggest since November. And it wasnt just crude stocks that rose – imports to the country hit a 14 month high, which was a major contributor to the build up.
But on the flip side, China provided a bit of a counterbalance – it looks like the country’s December crude imports surged by 17% year on year, while the full year 2025 imports actually rose by 4.4%. And the daily volumes being imported are at record levels. Still, thats not enough to get traders feeling super confident about demand being able to absorb all the rising supply in the short term.
WTI Technicals: Pullback not a Breakdown
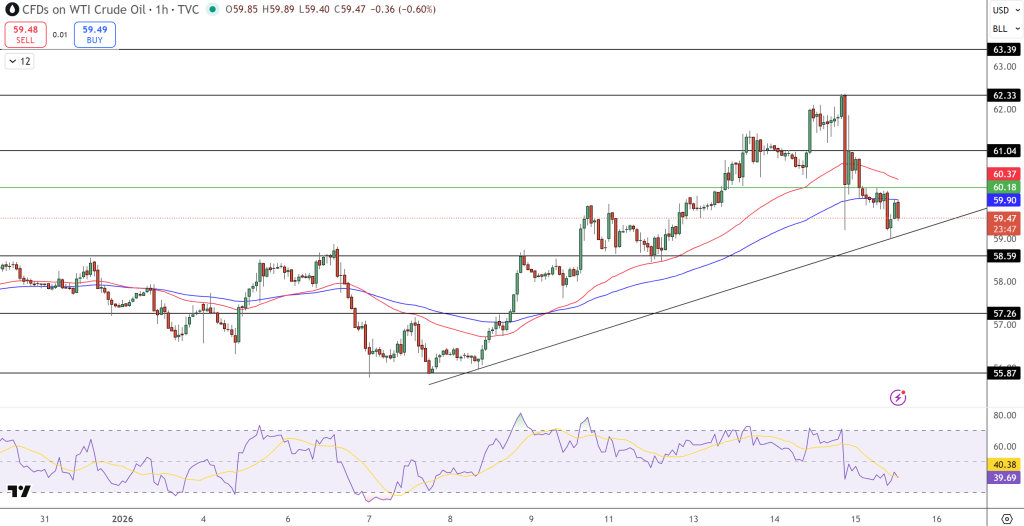
Looking at the technicals, WTI crude is currently consolidating around $59.50 after failing to hold above the resistance level of $62.30 and has slipped below the 50 day moving average near $60.35 and is now testing the 200 day moving average around $59.90 which is signalling a short term loss of momentum
But the overall structure of the market is still holding up – WTI is still trading above a trend line that formed from the bottom of the $55.90 low in January and the pull back is actually lining up with the 38.2% Fibonacci retracement of the recent rally. Support is at $59.00 and then $58.60 while resistance is layered at $60.35 and $61.05. And the RSI below 40 is a bearish sign but not quite oversold.
Trade Idea: If you want to buy in, do it near $58.60 and aim to sell at $61.00 with a stop loss below $57.80.
- Check out our free forex signals
- Follow the top economic events on FX Leaders economic calendar
- Trade better, discover more Forex Trading Strategies
- Open a FREE Trading Account
- Read our latest reviews on: Avatrade, Exness, HFM and XM
Related Articles


Sidebar rates
Related Posts
Ava

