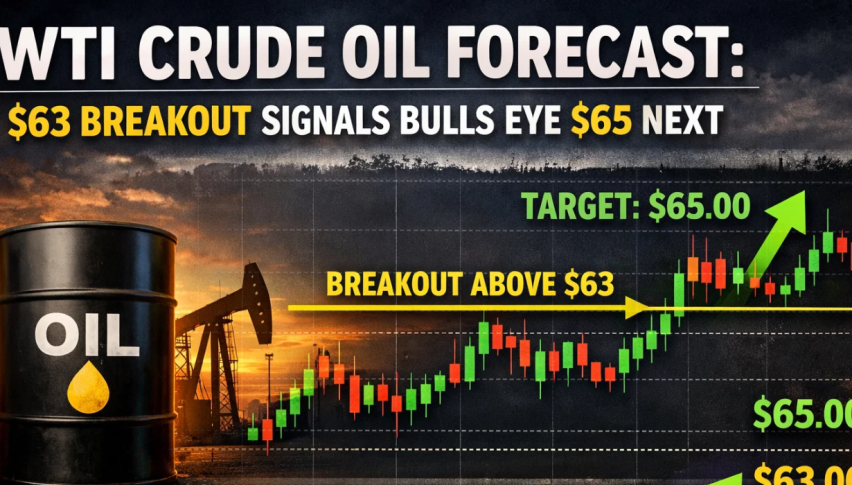
WTI Crude Oil Forecast: $63 Breakout Signals Bulls Eye $65 Next
WTI crude oil is trading close to $62.80, building on its rebound after moving above the $62.35 resistance on the 2-hour chart.
Quick overview
- WTI crude oil is trading around $62.80, maintaining a bullish trend after breaking above the $62.35 resistance level.
- The price remains above key moving averages, indicating a positive medium-term outlook and strong demand despite minor pullbacks.
- Momentum indicators show strong upward movement without signs of being overbought, supporting the continuation of the bullish trend.
- As long as WTI stays above $62.35, the outlook favors a potential test of the $65 area.
WTI crude oil is trading close to $62.80, building on its rebound after moving above the $62.35 resistance on the 2-hour chart. After several sessions of higher lows, buyers have taken control following January’s consolidation. The price is now staying above the old resistance, which suggests the breakout is holding.
This move is not sudden or driven by news. Instead, it shows steady buying, with buyers coming in regularly above rising support. The market setup points to a continued move higher as crude approaches the top of its recent range.
WTI Crude Oil (USOIL) Trend Structure Supports Further Upside
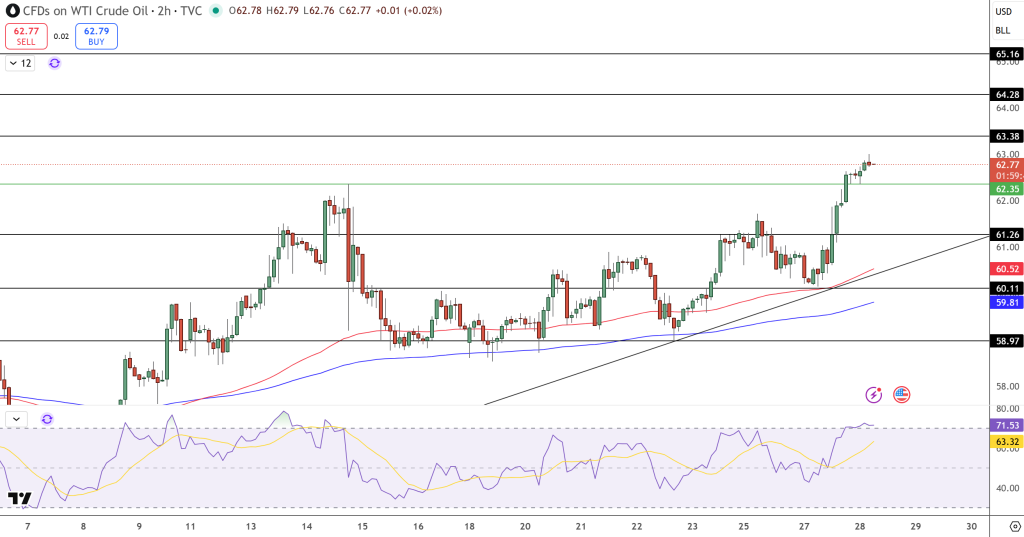
From a technical view, WTI is still moving within a rising channel, following a clear upward trendline that has held since mid-January. The price is staying above both main moving averages.
The 50-EMA is moving up and remains above the 200-EMA near $59.80, which supports a positive medium-term outlook. Pullbacks to the $60.50 to $60.10 area have been minor and have not disrupted the trend, showing strong demand.
Key levels in focus:
- Immediate support: $62.35, then $61.25
- Deeper support: $60.50 and $59.80
- Resistance: $63.38, followed by $64.28 and $65.16
If the price stays above $62.35, the breakout remains in place.
Momentum Confirms the Breakout
Momentum indicators support the bullish move. The RSI is above 60, showing stronger upward momentum but not yet overbought. There is also no sign of bearish divergence as the price climbs.
Recent candlesticks have closed strongly with small upper wicks, which means buyers are still active even as the price meets resistance. This pattern often appears when a trend is continuing, especially with rising averages and trendlines.
WTI Technical Outlook: Bulls Target $65 Zone
As long as WTI stays above $62.35, any pullbacks will likely be minor. If the price moves clearly above $63.38, it could reach $64.28 and then the $65.10 to $65.20 area, where sellers may step in.
If the price falls below $61.25, the bullish outlook would be delayed and attention would turn to the trendline near $60.50. Only a drop below $59.80 would seriously weaken the trend.
Outlook: With trend support holding, moving averages in agreement, and strong momentum, WTI crude looks set to keep moving higher. The near-term view favors a test of the $65 area instead of a return to range trading.
- Check out our free forex signals
- Follow the top economic events on FX Leaders economic calendar
- Trade better, discover more Forex Trading Strategies
- Open a FREE Trading Account
- Read our latest reviews on: Avatrade, Exness, HFM and XM
Related Articles


Sidebar rates
Related Posts
