WTI Crude Oil Price Forecast: “Peace Pivot” Shatters War Premium as Bearish Surplus Looms
WTI Crude Oil plunges 5% as US-Iran diplomatic breakthroughs erase January's risk premium. Explore the technical breakdown...
Quick overview
- WTI Crude Oil dropped 5% following diplomatic breakthroughs between the US and Iran, eliminating the previous 'war premium.'
- OPEC+ has decided to maintain production levels for March 2026, citing seasonal demand weakness.
- Technical analysis indicates a bearish trend with critical support levels at $61.50 and $60.00, while resistance is seen at $63.50 and $65.00.
- Analysts predict that WTI prices could average $52 per barrel in 2026 due to an oversupplied market.
WTI Crude Oil plunges 5% as US-Iran diplomatic breakthroughs erase January’s risk premium. Explore the technical breakdown, OPEC+ output freeze, and why the 2026 surplus could drive prices toward $52.
On February 3, 2026, WTI Crude Oil continued its sharp decline, trading around $61.70 to $62.00. After a strong rally in January that pushed prices to a two-year high of $66.60, the market has quickly shifted lower as risk factors faded.
A sudden diplomatic shift between Washington and Tehran removed the $4 to $8 ‘war premium,’ revealing the market’s ongoing surplus.
Key Takeaways: The February Liquidity Flush
- Dramatic Reversal: WTI Crude (March ’26) dropped 5.3% on Monday, marking its biggest one-day fall in months after gaining 7.6% in January.
- Diplomatic Breakthrough: Over the weekend, President Trump said Iran is “seriously talking,” easing concerns about military conflict. Formal talks are now set to take place in Turkey.
- OPEC+ Output Freeze: On February 1, OPEC+ confirmed it will keep production steady for March 2026, holding quotas at December 2025 levels because of seasonal demand weakness.
- Inventory Realities: While the EIA reported a 2.3-million-barrel draw in U.S. crude stocks, inventories remain just 3% below the five-year average, providing an ample buffer against minor disruptions.
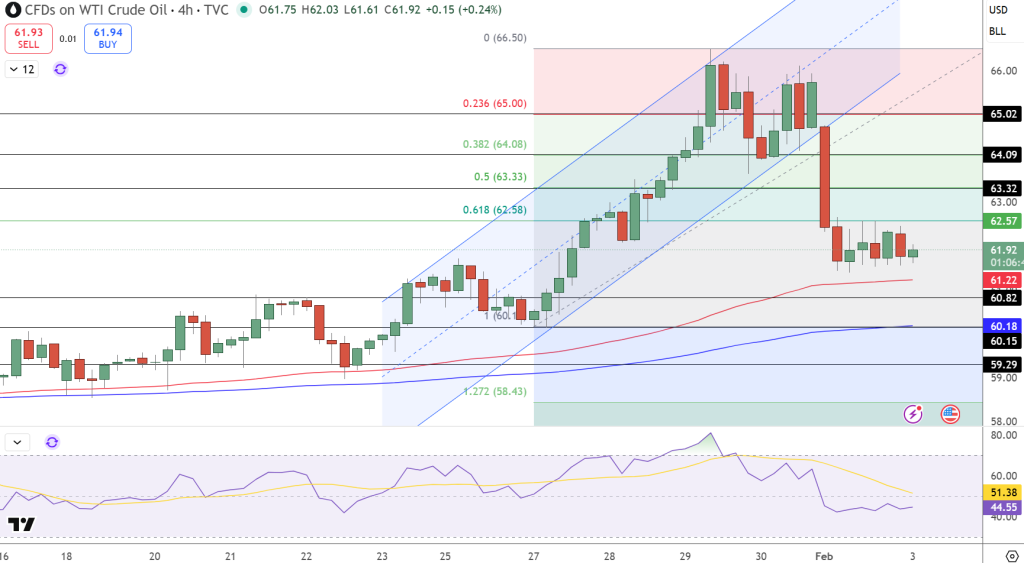
WTI Crude Oil Technical Analysis: The “Double Top” Rejection
The daily chart reveals the anatomy of a trend reversal as the market fails to sustain a breakout above its long-term descending channel.
- Fibonacci Retracement: After rejecting the $66.60 resistance, price action sliced through the 0.236 Fibonacci level ($65.00) and is now testing the 0.618 “Golden Ratio” floor at $62.58.
- Chart Patterns: A bearish “Double Top” has formed near the January peak, with the breach of the $63.50 neckline triggering technical sell orders.
- Momentum Indicators: The Relative Strength Index (RSI) has plunged from overbought levels (above 70) to 45, signaling that while the “war frenzy” has cooled, the bearish momentum is gaining strength.
- Moving Averages: Price has slipped below short-term EMAs, which are now curving downward to act as formidable resistance zones.
WTI Price Outlook: Can the $61.50 Floor Hold?
Analysts now expect 2026 to be ‘well-supplied,’ with global production likely to grow faster than demand.
- Immediate Support: Critical floors sit at $61.50 and $60.00. A breach below $60.00 would signal a shift into a deeper bearish phase, potentially re-exposing the $49.00 lower channel boundary.
- Resistance Ceiling: Any relief rally faces heavy selling pressure at $63.50 (the former neckline) and the psychological $65.00 level.
- 2026 Consensus: The EIA projects WTI will average $52/b in 2026 (down from $65 in 2025), as global liquid fuel production increases by 1.4 million b/d.
Trade Idea: Look for a possible ‘dead cat bounce’ up to $63.27. A short position could target the $59.47 area, with a tight stop-loss above $65.48.
Bottom Line: The ‘War Premium’ has faded in the face of technical factors. While geopolitical events may cause short-term rallies, the 2026 market is shaped by ongoing oversupply and a stronger U.S. dollar. Investors should focus on risk management as crude returns to its $52–$58 range.
- Check out our free forex signals
- Follow the top economic events on FX Leaders economic calendar
- Trade better, discover more Forex Trading Strategies
- Open a FREE Trading Account
- Read our latest reviews on: Avatrade, Exness, HFM and XM
Related Articles


Sidebar rates
Related Posts
