Solana Tests $100 Support, but Record Network Activity Signals a $260 Recovery Path
Solana (SOL) is trading around $99, down 4.2% in the previous 24 hours, as the leading layer-1 blockchain tests a historically critical
Quick overview
- Solana (SOL) is currently trading at around $99, down 4.2% in the last 24 hours, as it tests a critical support level that could influence its price trajectory.
- Technical analysis suggests a potential V-shaped recovery pattern, with support found at the $100 level, while the RSI indicates emerging upward momentum.
- Despite recent price declines, Solana's on-chain fundamentals are improving, with total value locked reaching an all-time high and significant increases in network activity.
- Analysts are considering multiple scenarios for Solana's future price movements, ranging from a bullish rally towards $260 to potential bearish consolidation below $95.
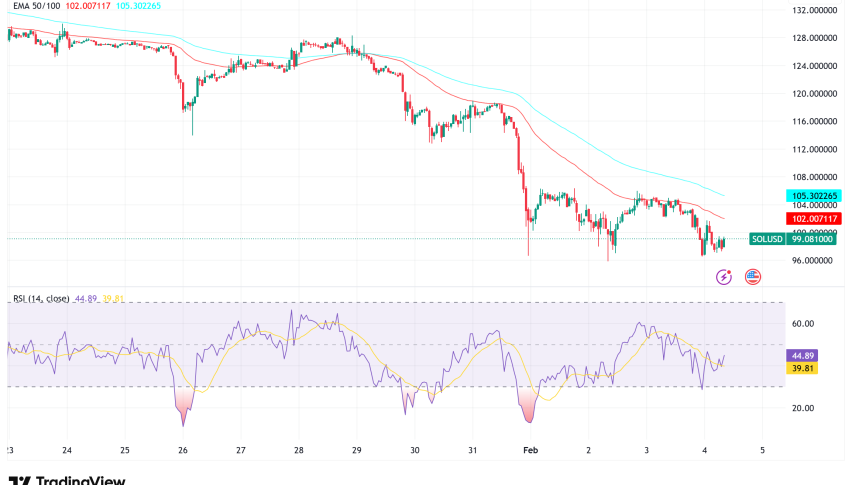
Solana SOL/USD is trading around $99, down 4.2% in the previous 24 hours, as the leading layer-1 blockchain tests a historically critical support level that might determine if bulls can make a recovery toward $260 or risk further decline.
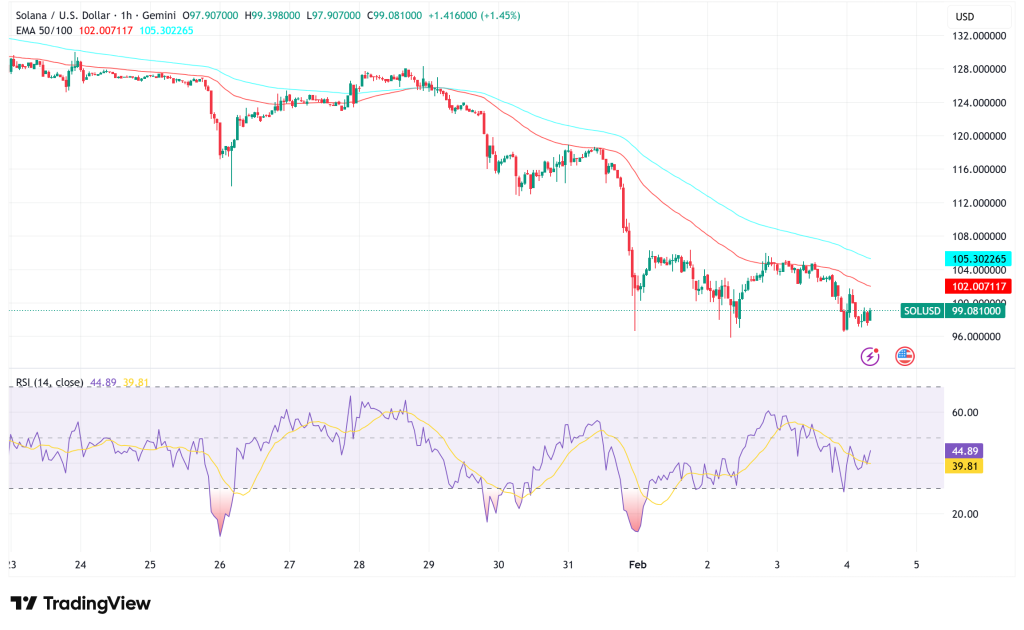
The cryptocurrency has experienced heightened volatility over the previous day, with values ranging between a low of $96.81 and a high of $104.91, reflecting persistent concern in the broader crypto market.
SOL/USD Technical Analysis: V-Shaped Recovery Pattern Formation
According to technical analysis from numerous crypto specialists, Solana appears to be building a probable V-shaped recovery pattern on the four-hour chart following a strong 25% decline from recent highs of $127. The drop found support at the psychologically crucial $100 level, where purchasers have typically stepped in to preserve the price.
The relative strength index (RSI) has rallied to 36 from highly oversold levels at 18 on the four-hour period, signaling the emergence of upward momentum. More significantly, the daily RSI reported 29, a level that has previously signified market bottoms and generated strong SOL price recovery.
Solana has returned to a crucial weekly demand zone that has acted as a turning point during this market cycle, according to cryptocurrency analyst Cyril-DeFi. Cyril clarified that a firm hold at current levels would put Solana in a position to lead the next cryptocurrency impulse wave. “This is the type of zone where strong trends tend to reload if buyers successfully defend it,” he said.
Multiple Resistance Levels Stand Between Current Price and $260 Target
Bulls have a number of major challenges on their road to recovery, even though the technical setup seems promising. The first big obstacle is at the $113-$115 supply range, where key trendlines intersect. The first indication of bullish momentum would be a breakthrough of this zone.
The 50-day exponential moving average (EMA) and 50-day simple moving average (SMA) both define the second important resistance level, which is between $125 and $130. This zone previously acted as support before being lost during the latest selloff.
Beyond these levels, SOL would need to regain the pattern’s neckline around $150, which marks a possible 44% increase from current prices. Trader Ardi noted that the $119 level serves as a critical pivot, noting that “a successful reclaim of this zone, ideally through a spring or brief fakeout below resistance, could signal that demand is returning.”
Long-Term Target: Historical Support Level Points to $260
Taking a longer-term view, the weekly chart suggests sturdy support for SOL in the $95-$100 level. Notably, the previous substantial rebound from this level spurred a 166% rise to $250 between April and September 2025. If history repeats, analysts predict SOL might extend its current rebound to $260 over the next weeks or months, marking a possible 150% increase from present prices.
The 50-week moving averages, positioned between $140-$160, have traditionally acted as resistance during price advances and will likely serve as a significant test zone throughout any persistent uptrend.
Trader Tardigrade offered an alternate perspective, arguing that SOL’s rebound from the lower boundary of a descending channel pattern might bring prices toward the top barrier around $215.
Solana’s On-Chain Fundamentals Provide Bullish Backdrop
Despite the price drop, Solana’s on-chain indicators are painting an increasingly positive picture. The network’s total value locked (TVL) reached an all-time high of 73.4 million SOL on Monday, worth nearly $7.5 billion at current values. This represents an 18% surge over the past week and surpasses the previous best achieved in June 2022 at 68.3 million SOL.
The last time TVL reached similar levels in mid-2022, propelled by high network activity and the NFT boom, SOL price subsequently soared 80% over the following two months.
Network activity data further support the positive basic case. On Monday, the daily decentralized exchange (DEX) volume reached an eight-month high of $51.3 million SOL, while daily transactions on Solana reached a two-year high of 109.5 million. During the week ended Sunday, weekly DEX trade volume reached a 12-month high of 264.8 million SOL.
Additionally, daily active addresses on Solana climbed 115% during the second half of January, a pattern that has traditionally accompanied favorable price action for SOL.
Institutional Interest Continues to Build
Recent advancements in institutional adoption have offered another layer of fundamental support. Following the launch of Solana spot ETFs in late 2025, major issuers including Bitwise and Fidelity have garnered considerable inflows, with total Solana ETF assets approaching $1 billion. Morgan Stanley has also entered the field by applying for its own Solana Trust.
Regarding corporate treasury, Forward Industries has evolved into a Solana-focused treasury firm, managing its own validator node on the network and storing more than 6.9 million SOL worth little less than $1 billion.
Solana Price Prediction: Multiple Scenarios in Play
Based on the intersection of technical patterns and on-chain fundamentals, analysts are analyzing many potential scenarios:
- Bullish case: A successful defense of the $100 support level, followed by a reclaim of $119 resistance, might start a rally above $150 in the immediate term and potentially $260 over several months, mimicking the 150% gain witnessed from comparable support levels in 2025.
- Base case: SOL consolidates between $95-$130 as the market digests recent volatility, with the 50-day moving averages around $125-$130 serving as the primary battleground for trend determination.
- Bearish case: A fall below $95 would invalidate the bullish thesis and might lead to lengthy consolidation or additional decline, with analyst Ardi noting that “in a broader downtrend, odds are often against traders until a major level is reclaimed.”
However, Ardi also identified an alternate support level at the 200-week simple moving average near $100, which previously performed as macro support in April 2025, suggesting this zone could provide a final line of defense for bulls.
- Check out our free forex signals
- Follow the top economic events on FX Leaders economic calendar
- Trade better, discover more Forex Trading Strategies
- Open a FREE Trading Account
- Read our latest reviews on: Avatrade, Exness, HFM and XM
Related Articles


Sidebar rates
Related Posts
