Solana Faces Death Spiral Fears at $81: Bearish Technicals Target $50 Despite Record Ecosystem Revenue
Solana (SOL), which has lost 3.4% in the past day, is presently negotiating a high-stakes stalemate at the $81 level. Despite the network's
Quick overview
- Solana has experienced a 3.4% decline and is currently at a critical $81 level, with analysts predicting a potential drop to $50 due to a weakening technical structure.
- The formation of a Head-and-Shoulders pattern on the weekly chart indicates a bearish trend, with a target price of $57 based on technical analysis.
- Despite the price decline, institutional investors are showing strong interest in Solana ETFs, with significant inflows totaling $877 million, suggesting a divergence from bearish market sentiment.
- Solana's immediate price trajectory hinges on the $78–$80 support zone, with potential outcomes ranging from a bearish scenario at $50 to a bullish scenario targeting $120.
Solana SOL/USD, which has lost 3.4% in the past day, is presently negotiating a high-stakes stalemate at the $81 level. Despite the network’s continued dominance of on-chain activity, analysts are warning of a possible decline to $50 due to a weakening technical structure, even as institutional ETF inflows indicate a widening gap between market price and fundamental utility.
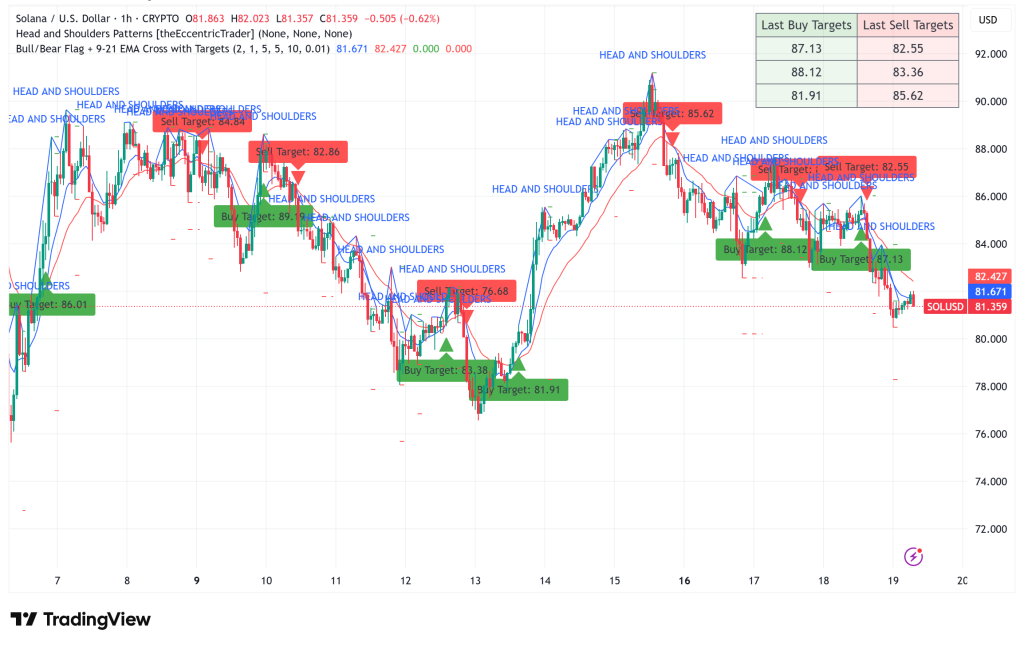
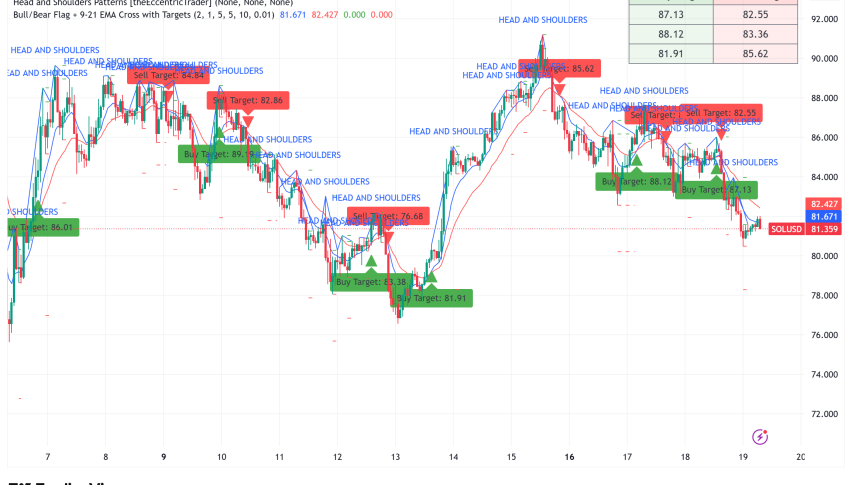
SOL/USD Technical Breakdown: The Head-and-Shoulders Pattern Confirmed
On the weekly chart, Solana’s multi-month price action has created a traditional Head-and-Shoulders (H&S) pattern, which is a significant bearish indicator. The price fell below the $120 neckline in late January, signaling the start of the fall.
- The Measured Move: By estimating the height of the head from the breakdown point, technical models determine the downside goal, setting a definite target of $57.
- Daily Bear Flag: SOL is now retesting the bottom boundary of a bear flag at $80 on the shorter timeframe. The pattern would be confirmed with a daily closure below this level, which would probably hasten the collapse below the $48–$50 range, or almost 40% below present prices.
- Momentum Indicators: At 33.2, the Relative Strength Index (RSI) indicates that the market is oversold. The Average Directional Index (ADX) has surged to 28, suggesting that the downward trend is really getting stronger, even though this frequently comes before a relief rally.
The Death Spiral vs. Solana Ecosystem Dominance
The decline in price has raised worries about an incentive death spiral. Capital flight may result from declining liquidity provider incentives and staking rewards when SOL prices decline. Revenue from dApps recently fell to $22.8 million, a multi-year low, from a record $146 million in January 2026.
Solana is still the leader in high-volume activities in spite of this. Due in large part to the memecoin launchpad PumpFun ($46M) and decentralized exchanges like Meteora, it had the highest earnings in January out of all Layer 1 and Layer 2 chains. In contrast to Ethereum’s infrastructure-heavy DeFi lead, critics contend that Solana is more susceptible to “beta sell-offs” during times of market trepidation due to its strong reliance on retail memecoin enthusiasm.
Spot Solana ETF Inflows Defy Bearish Sentiment
Institutional investors are buying the dip through regulated channels, which is a significant divergence. During their first 74 trading days, U.S.-based spot Solana ETFs saw inflows on 66 of those days.
- Cumulative Inflows: Total net inflows for SOL ETFs have reached $877 million, with Bitwise’s BSOL leading the pack.
- On-Chain Bottom Signal: The MVRV (Market Value to Realized Value) ratio has dropped below 0.8, a threshold historically associated with Extreme Lows. This level has only been reached during 5% of Solana’s trading history, often preceding significant multi-month rallies.
Solana Price Prediction: Two Scenarios for 2026
The $78–$80 support zone determines SOL’s immediate course.
- Bear Case ($50–$65): The path of least resistance indicates that if the psychological support at $80 is not met, buyers from the 2022 bear market are likely to intervene at the $50 level.
- Bull Case ($120 to $150): A short squeeze might happen if institutional demand keeps the price stable. The first indication of a reversal would be a confirmed breakout above $92, which might target the previous neckline of $120 by mid-2026.
- Check out our free forex signals
- Follow the top economic events on FX Leaders economic calendar
- Trade better, discover more Forex Trading Strategies
- Open a FREE Trading Account
- Read our latest reviews on: Avatrade, Exness, HFM and XM
Related Articles


Sidebar rates
Related Posts
Ava

