Silver Price Prediction: Is the $100 Breakout Next? Why $83.90 is the “Line in the Sand” for Bulls
The silver market is currently a high-octane battleground between extreme geopolitical fear and aggressive profit-taking...
Quick overview
- The silver market is experiencing volatility due to geopolitical tensions and profit-taking, with prices currently around $85.00 per ounce.
- Silver's dual role as a safe-haven asset and an industrial metal is being tested amid the U.S.–Israel–Iran conflict and ongoing supply deficits.
- Institutional forecasts for 2026 suggest potential price targets for silver could reach between $135 and $309, driven by a possible collapse in the gold/silver ratio.
- Recent price action indicates a rebound from a low of $79, with key resistance levels at $87.36 and $92.21, while support remains at $83.00.
The silver market is currently a high-octane battleground between extreme geopolitical fear and aggressive profit-taking. As of March 4, 2026, the “White Metal” is staging a calculated comeback, trading near $85.00–$85.13 per ounce, up approximately 4% on the day.
After a brutal 11% plunge on March 3, triggered by a surging U.S. Dollar and a temporary liquidation in risk assets, silver is once again finding its footing. With the U.S.–Israel–Iran conflict intensifying and the Strait of Hormuz facing potential disruption, silver’s dual identity as a safe-haven and a critical industrial metal is being put to the ultimate test.
The “War Premium” vs. The Industrial Deficit
Silver’s current price action is being squeezed by two powerful forces that are rarely in sync.
- Geopolitical Safe-Haven Demand: The coordinated military strikes on Iranian leadership and the subsequent threats of regional retaliation have sent investors scrambling for tangible assets. While gold often takes the spotlight, silver’s lower price point and high volatility make it a favorite for tactical traders looking to hedge against a “Black Swan” event in the Middle East.
- The Structural 67 Million Ounce Shortfall: Beyond the headlines of war, the silver market is entering its sixth consecutive year of physical deficit. Demand from AI data centers, solar infrastructure, and the EV sector continues to outpace mining production, which has largely plateaued. This underlying “supply-demand crunch” provides a fundamental floor that prevents corrections from turning into collapses.
- The Energy Shock Angle: As Brent crude surges past $82, inflation fears are resurfacing. Silver historically thrives in high-inflation environments, acting as a “leveraged play” on gold’s movements.
2026 Forecast: Is $135 Realistic?
Despite the recent volatility, institutional price targets for 2026 remain remarkably high.
- P. Morgan Target: The bank maintains a 2026 average forecast of $81 per ounce, noting that the current geopolitical climate could easily push prices toward the $100 mark by mid-year.
- Extreme Compression Scenarios: Some analysts are eyeing a collapse in the gold/silver ratio (currently near 63). If the ratio compresses toward historical norms of 30 or 40 during a “commodities super-cycle,” silver targets of $135–$309 become a statistical possibility.
- Industrial Floor: Even if the war de-escalates, the green energy transition ensures that industrial fabrication demand will remain at record highs near 650 million ounces.
Silver Price Prediction: Can $85 Rebound Extend Toward $92?
Silver is stabilizing near $85 after a sharp 7–10% drop toward $79 earlier this week, as conflict-driven volatility and oil-led inflation fears reshaped flows across metals. The rebound of nearly 3–4% reflects renewed safe-haven demand, while industrial demand expectations remain intact amid persistent supply deficits.
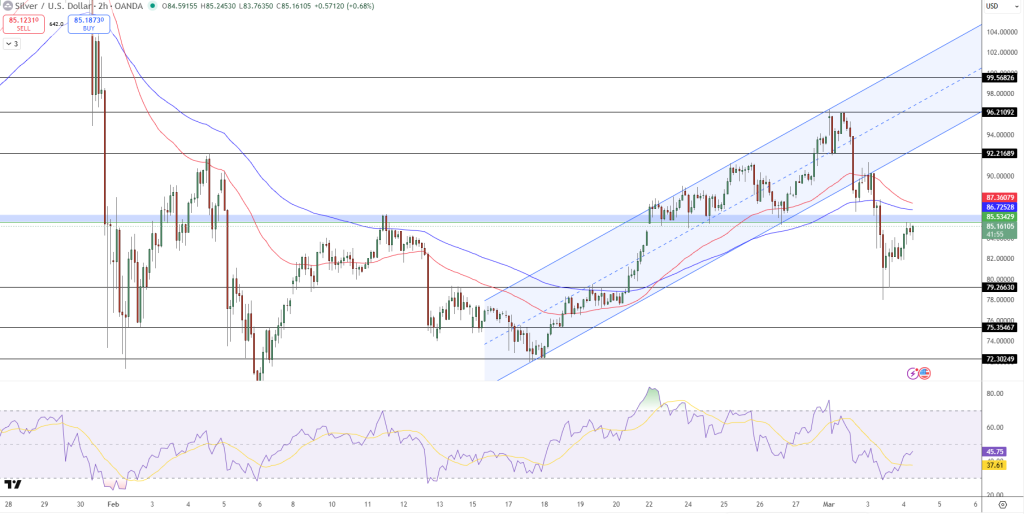
On the 2-hour chart, price reclaimed the $85.35 zone after defending $79.26 support, which aligns with prior horizontal demand and a key Fibonacci retracement from the January peak above $120. The breakdown below the rising channel near $87.36 triggered liquidation, but the structure is attempting to rebuild above $83.
The 50-EMA at $87.36 and 100-EMA near $86.72 now act as dynamic resistance. Candlestick structure shows strong bullish recovery candles from $79, followed by tighter-bodied consolidation near $85, indicating absorption rather than exhaustion. RSI has rebounded to around 45 from oversold territory near 30, suggesting momentum reset but not yet full bullish confirmation.
Immediate resistance stands at $87.36, followed by $92.21. Support remains at $83.00 and $79.26. Holding above $83 keeps the short-term recovery intact, while a move through $87 could open the path toward $90–$92.
Trade idea: Buy above $86.80 targeting $92.20, stop below $83.90.
- Check out our free forex signals
- Follow the top economic events on FX Leaders economic calendar
- Trade better, discover more Forex Trading Strategies
- Open a FREE Trading Account
- Read our latest reviews on: Avatrade, Exness, HFM and XM
Related Articles
Sidebar rates
Related Posts
Ava

