Gold Price Forecast: Will the $5,020 Support Hold as the Middle East “Risk-Off” Premium Fades?
The gold market is stuck in a nerve-wracking period of stability following its breakout in early 2026 . On the 9th of March, 2026...
Quick overview
- The gold market is currently stable, trading between $5,090 and $5,105, following a peak of $5,589 in late January 2026.
- Central banks, particularly in China, continue to buy gold, contributing to a structural price floor around $5,000.
- Gold is being viewed as a hedge against rising inflation due to geopolitical tensions and high oil prices, with forecasts suggesting a year-end price of $5,400.
- Technical analysis indicates that gold is in a symmetrical triangle pattern, with key support at $5,020 and resistance around $5,185.
The gold market is stuck in a nerve-wracking period of stability following its breakout in early 2026 . On the 9th of March, 2026, you can spot gold on the XAU/USD market trading anywhere between $5,090 and $5,105 – & still hovering comfortably above that $5,000 threshold. Gold had taken a bit of a tumble after peaking at $5,589 in late January – now it’s like a pressure cooker waiting to explode. Traders have a real conundrum on their hands, trying to weigh up the safe-haven demand from the US-Israel-Iran conflict against the strengthening US dollar, which makes gold much more expensive for buyers around the world.
The dominant storyline for March has been that classic tale of “buy the rumour, sell the fact.” Gold shot up an impressive 5% in the early part of March when the joint strikes on Tehran were confirmed – but as the market realised that oil was still flowing through the Strait of Hormuz despite being threatened, those gains evaporated in no time. This “geopolitical fatigue” has left gold in a bit of a limbo, waiting on a fresh fundamental catalyst – such as the upcoming U.S. inflation data – before it decides which way it will move next.
Central Banks Start to Diversify: That Structural Floor at $5,000
Even taking into account short-term price swings, the case for gold still looks pretty strong because central banks keep buying. On the 7th of March, new data showed that China’s gold reserves had grown for the 16th consecutive month, now sitting at 74.22 million ounces. It’s happening in lots of emerging markets too – & that’s setting a lasting price floor that even some of the more traditional models are struggling to explain.
- Sovereign Governments Want To Hedge: Central banks are expected to buy an enormous 800 tonnes of gold in 2026, which is equivalent to around 26% of all the gold that gets mined around the world each year. This buying isn’t about the price so much as it’s about protecting against U.S. fiscal deficits and other financial risks.
- The Inflation Insurance Policy: When you take a look at the oil prices which have been sitting at around $90 a barrel thanks to the Middle East tensions, the risk of global inflation rising is looking a lot higher. Gold is back on people’s radar as the number one hedge against inflation caused by energy costs – even if interest rates are still a bit high.
- The Professionals Rebalance Their Portfolios: Goldman Sachs recently upped their year-end 2026 forecast for gold to $5,400 – they reckon a lot more private investors are now treating gold as an essential part of a balanced portfolio in this increasingly complicated global environment.
Gold (XAU/USD) Technical Analysis: The Symmetrical Triangle Showdown
When you take a look at the 4-hour chart for gold you can see that at the moment it’s stuck in a large-scale symmetrical triangle – & the price is getting squeezed between a descending resistance line (from the $5,415 peak a while back) and an ascending support trendline that’s been holding firm since early February. This kind of consolidation usually comes before an explosive surge in volatility.
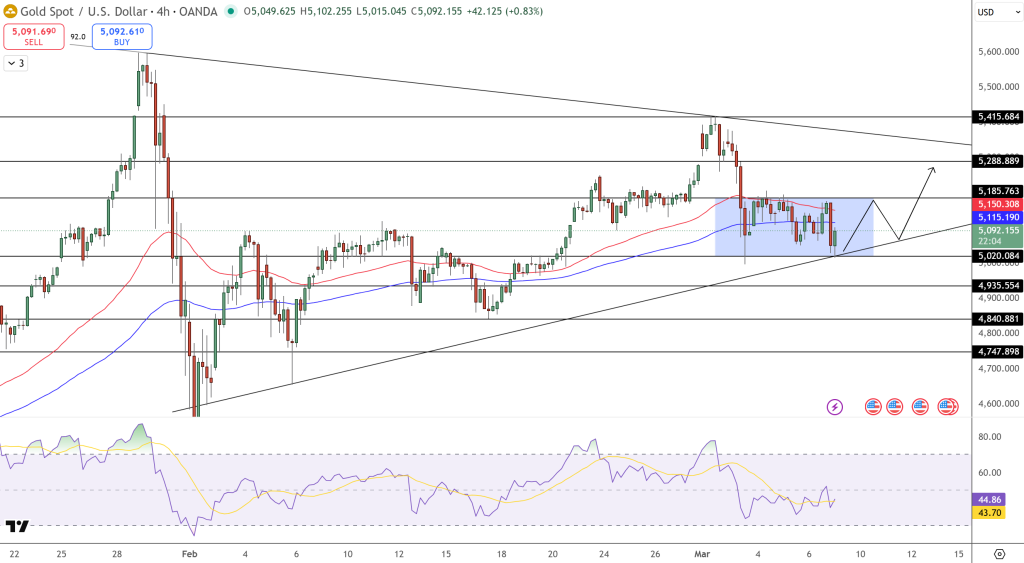
Currently, XAU/USD is up against the “moving average crossover”, where the 50-period and 200-period averages are converging right around the $5,100 level.
For the bulls gold is still good as long as it stays above $5,020. If it can manage to hold above this level the medium-term uptrend is still intact. A strong move above $5,185 would show the correction is over and it could be onto a quick rally towards $5,400 – but if gold starts to fall below $5,000 it could drop all the way to the $4,840 demand zone where a lot of big buyers are waiting in the wings. The RSI at 44.86 shows that the market has reset from being overbought and it’s now ready for its next big move.
- Check out our free forex signals
- Follow the top economic events on FX Leaders economic calendar
- Trade better, discover more Forex Trading Strategies
- Open a FREE Trading Account
- Read our latest reviews on: Avatrade, Exness, HFM and XM
Related Articles

Sidebar rates
Related Posts
