Adobe Inc. stock has retraced to a critical golden ratio support zone around $245, marking a key inflection point for its trend.
A confirmed breakdown below this level could trigger accelerated downside momentum, with potential targets at $205 and lower.
Despite a recent 16.5% relief rally, the overall trend remains bearish, indicated by death crosses in the EMAs and weak momentum indicators.
If the support holds, there is potential for a bullish rebound towards resistance levels between $264 and $420.
Adobe Inc. stock (ADBE) has retraced to a critical golden ratio support zone, marking a key inflection point for the broader trend. A confirmed breakdown below this level would likely trigger accelerated downside momentum, exposing the stock to significantly lower price levels.
Adobe Inc. (ADBE) Tests Critical Golden Ratio Support Amid High-Stakes Reversal Setup
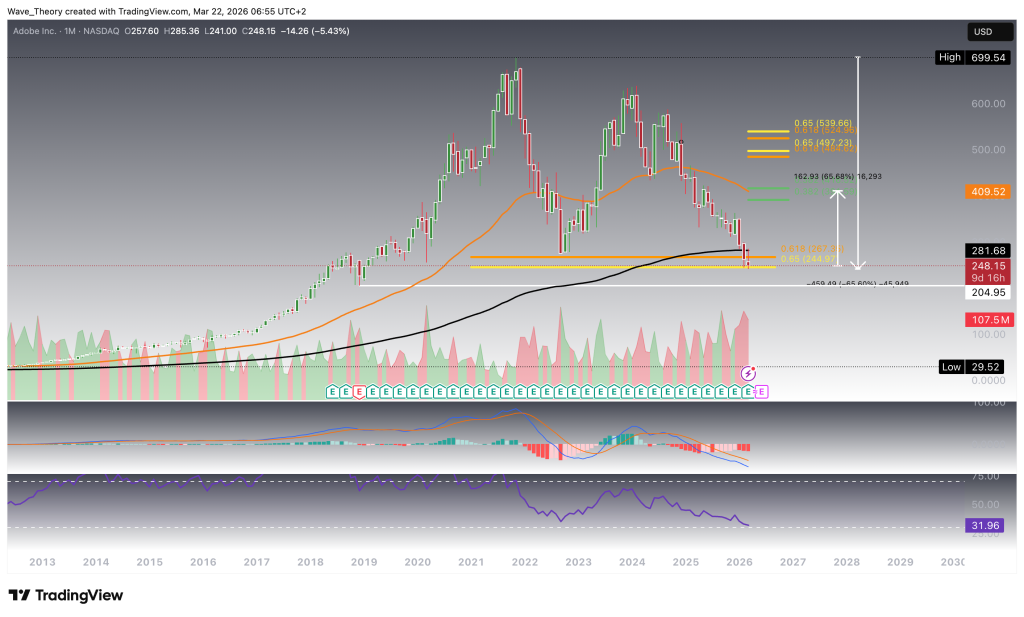
Adobe has declined by more than 65% over the past years, now reaching a decisive inflection point at the golden ratio support near $245—arguably the most critical structural level in the current cycle. A confirmed breakdown below this threshold would significantly deteriorate the technical outlook, likely triggering a renewed bear market phase, with interim support at $205 acting as the final buffer before the risk of a move toward unprecedented lower levels emerges.
From a bullish perspective, this confluence support zone opens the door for a potential high-magnitude rebound, with upside targets defined at the 0.382 Fibonacci resistance between $390 and $420. Within this region, the 50-month EMA at approximately $410 adds an additional layer of technical resistance. Notably, despite the prolonged corrective phase, the EMA structure has preserved a golden crossover, reaffirming that the long-term trend bias remains structurally bullish.
However, momentum indicators continue to reflect underlying weakness: the MACD lines are bearishly crossed, and the MACD histogram has been declining consistently over the past three months, signaling persistent downside momentum. Meanwhile, the RSI is approaching oversold territory but remains non-confirmatory, offering neither a clear bullish reversal signal nor further bearish conviction at this stage.
Adobe stock
Adobe Inc. Stock (ADBE) Weekly Death Cross Confirms Bearish Mid-Term Trend Despite Early Stabilization Signals
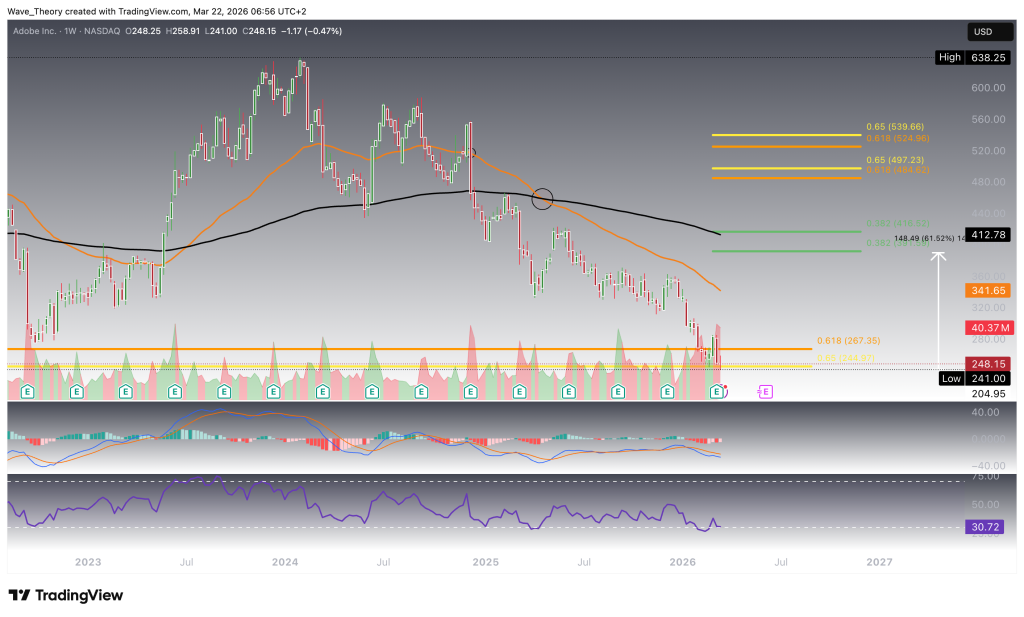
On the weekly timeframe, Adobe’s trend structure remains clearly bearish, with the EMAs having established a confirmed death cross—reinforcing sustained downside pressure in the mid-term. While the RSI continues to hover in neutral territory, the MACD histogram has begun to tick higher this week, indicating early signs of momentum stabilization; however, the MACD lines themselves remain bearishly crossed, suggesting that a full bullish confirmation is still lacking.
Despite this prevailing bearish structure, Adobe has now reached a major Fibonacci support zone, which introduces the potential for a significant counter-trend move. A successful reaction from this level could trigger a bullish bounce of up to approximately 62%, highlighting the asymmetry between downside risk at support and upside potential in a relief rally scenario.
Adobe
Adobe Stock Retests Golden Ratio Support After 16.5% Bounce and Rejection at 50-Day EMA
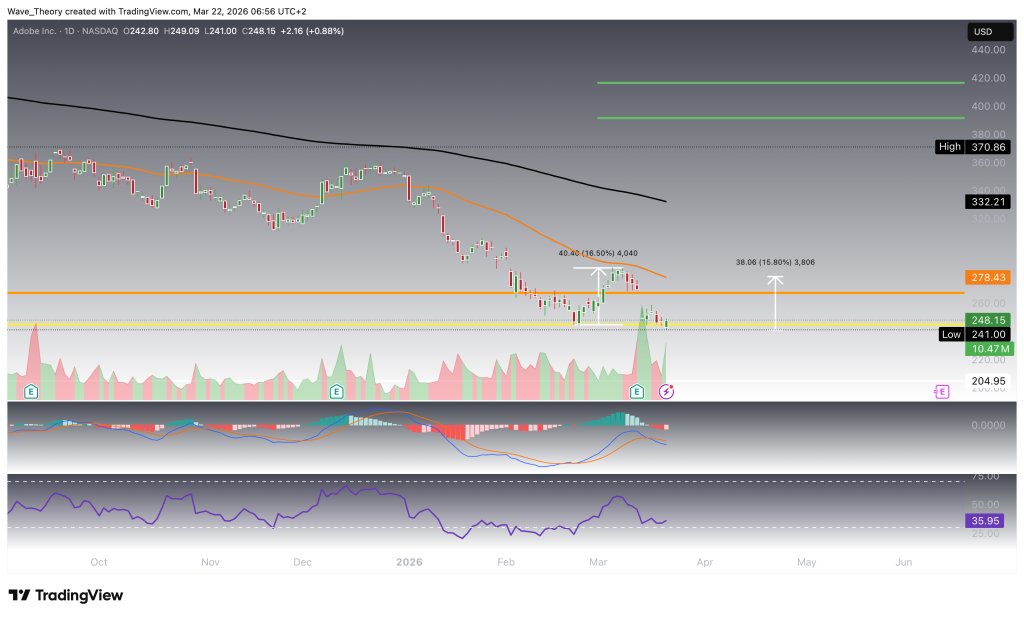
Adobe has already staged a relief rally of approximately 16.5%, but the move was capped by a clear rejection at the 50-day EMA resistance near $278. Price has since retraced back to the lower boundary of the golden ratio support zone, where a renewed bullish reaction could emerge, offering a potential upside of roughly 16% on a retest of the $278 resistance level.
Despite this rebound potential, the short- to medium-term structure remains bearish. The EMAs have confirmed a death cross on the daily chart, while the MACD lines are bearishly crossed and the RSI continues to move in neutral territory, reflecting weak directional conviction. The only early sign of improvement comes from the MACD histogram, which has started to tick higher, suggesting the initial stages of a potential momentum shift.
Adobe
Adobe Inc. (ADBE) Consolidates at Key Support as Bearish Momentum Persists on Lower Timeframes
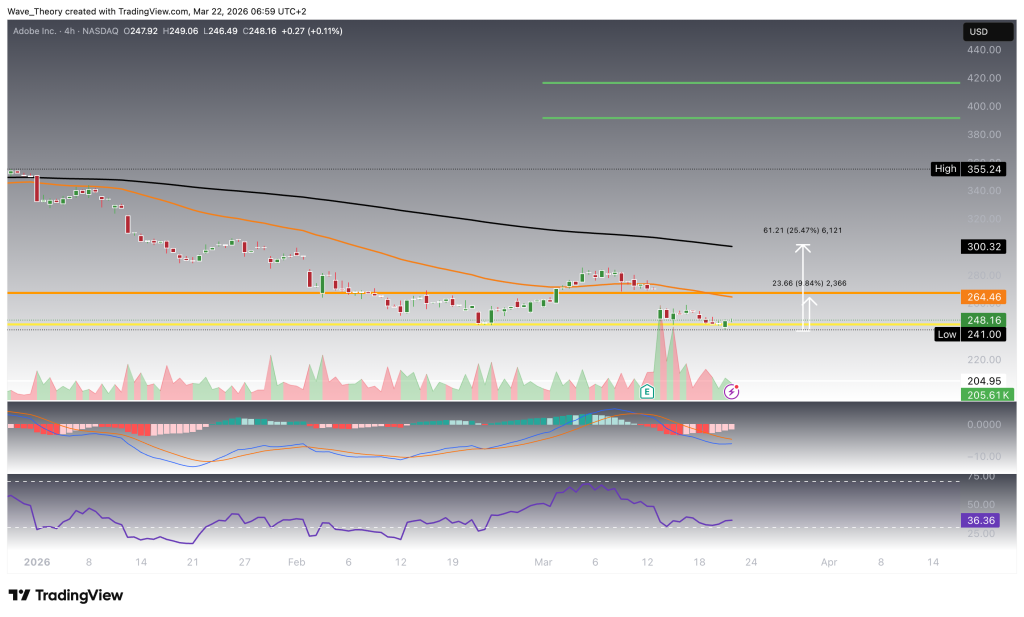
On the 4-hour chart, Adobe continues to consolidate at the lower boundary of its critical golden ratio support near $245–$248. A bullish reaction from this zone could drive a move toward the 50-4H-EMA at $264, implying upside potential of approximately 10%, while a more extended recovery toward the 200-4H-EMA at $300 would represent roughly 25.5% upside.
However, the broader indicator landscape remains predominantly bearish. The EMAs have established a death cross, confirming the short-term downtrend, while the MACD lines are bearishly crossed, signaling sustained downside momentum. That said, early signs of stabilization are emerging, with the MACD histogram beginning to tick higher and the RSI holding in neutral territory- suggesting that bearish momentum may be fading and opening the door for a potential short-term relief bounce.
Adobe
Adobe Inc. (ADBE) Key Levels and Technical Summary
Adobe is trading at a critical inflection point at the golden ratio support around $245, which defines the current structural outlook. As long as this level holds, the stock remains positioned for a potential bullish rebound, with upside targets at $264, $300, and the major resistance zone between $390–$420.
However, the broader trend remains mixed to bearish across lower timeframes, with confirmed death crosses and weak momentum indicators. A decisive breakdown below $245 would significantly deteriorate the structure, exposing downside toward $205 and potentially much lower levels, effectively confirming a continuation of the broader bear cycle.
Konstantin Kaiser comes from a data science background and has significant experience in quantitative trading. His interest in technology took a notable turn in 2013 when he discovered Bitcoin and was instantly intrigued by the potential of this disruptive technology.