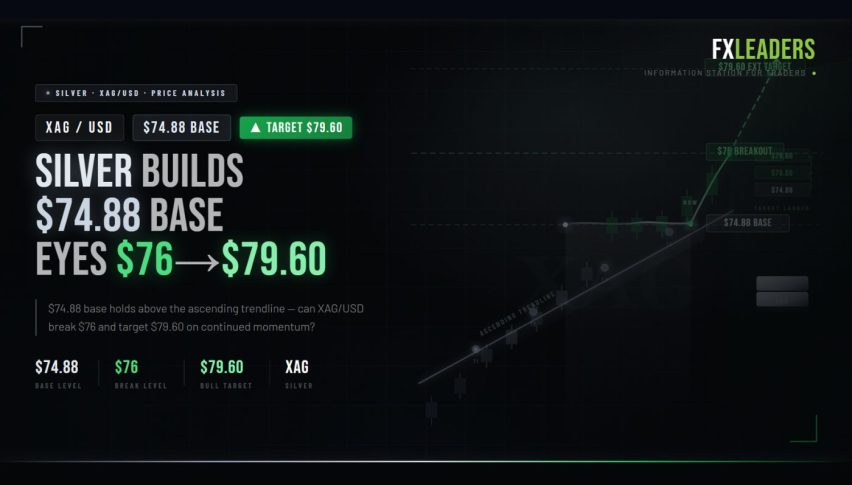
Silver Price Analysis: $74.88 Base Above Ascending Trendline – Can XAG/USD Break $76 and Target $79.60?
On April 1, 2026, XAG/USD is trading close to $74.88, holding steady above the $73.70 demand zone and forming higher...
Quick overview
- XAG/USD is trading at $74.88, showing a 22% increase from its Q1 low of $61.55 and forming higher lows along an upward trendline.
- The broader economic environment has improved, with Powell's comments on inflation easing pressure on silver prices, while the dollar index has decreased.
- Solar manufacturers are shifting to alternatives, which may reduce silver demand by 7% in 2026, but demand from AI, EVs, and semiconductors is expected to offset this decline.
- A breakout above $76 could target $79.60, while failure to hold $73.70 may risk a drop to $67.34.
On April 1, 2026, XAG/USD is trading close to $74.88, holding steady above the $73.70 demand zone and forming higher lows along an upward trendline. Since bouncing back from the $61.55 low, silver is showing its first real structural improvement since the March crash. Now, the key question is whether buyers can push past $76 to target the 200-SMA at $78.12.
Structure Is Shifting, But One Risk Needs Attention
Silver has climbed about 22% from its Q1 low of $61.55 to $74.88. The upward trendline from that low has been tested and held several times, showing a real shift from the steady declines seen in March.
The broader economic environment has improved slightly. Powell’s comments about inflation being “well-anchored” have lowered the 10-year yield, easing the pressure that led to the March selloff. The dollar index is now around 100.23, down from its highs, which gives some relief to silver priced in dollars.
There is one key point traders should keep in mind: solar manufacturers, who are the biggest industrial users of silver, are speeding up their shift to alternatives. According to BloombergNEF, solar silver demand is expected to drop about 7% year-on-year in 2026 to around 194 million ounces, even as global solar capacity keeps growing. Companies like Longi Green Energy, Jinko Solar, and Shanghai Aiko are moving toward large-scale production of copper-based or silver-free panels. Silver now makes up 17 to 29% of the cost per watt for PV modules, and with prices above $75, switching to alternatives makes financial sense.
This trend does not end the overall bullish outlook, since demand from AI data centers, electric vehicles, and semiconductors is making up for much of the shortfall. The supply deficit, now in its sixth year at 67 million ounces, is still a real factor. The deficit sets a floor for prices, while substitution limits how quickly prices can recover.
XAG/USD Technical Analysis: The $76 Gate
The 4-hour chart suggests a positive recovery, but it is not fully confirmed yet.
The price is at $74.88, above the $73.70 demand zone. The 50-SMA at $72.45 is moving up and offering support below. The 200-SMA at $78.12 is still the main resistance level above.
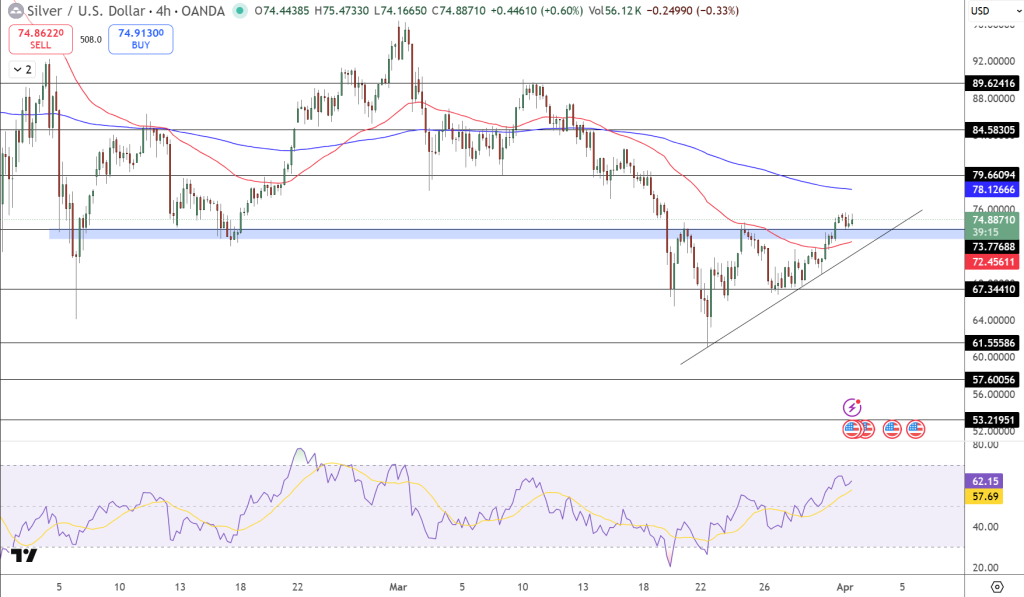
The RSI is at 62, which is considered bullish. Momentum looks positive but not overbought. The smaller candle bodies near resistance suggest the market is consolidating, not running out of steam.
$76 is the key level. If the price breaks and closes above $76 on the 4-hour chart, it could move toward $79.66, which was previous resistance, and bring the 200-SMA at $78.12 into focus.
Failure to hold $73.70 weakens the ascending trendline structure and risks a revisit of $67.34.
Trade setup (long bias): Buy above $75.50 | Target $79.60 | Stop below $72.40.
FAQ: Silver April Outlook- Trendline Base, Solar Risk, and Recovery Targets
Why is silver recovering in late March–early April 2026?
The ascending trendline from the $61.55 low has held across multiple tests, confirming a shift in structure from the March downtrend. Powell’s yield relief reduced the opportunity cost headwind, while the gold-silver ratio near 65:1 — historically stretched — is attracting value-oriented buyers expecting silver to close the gap with gold.
Does the solar substitution trend threaten silver’s recovery?
It moderates the speed of recovery rather than breaking the structural case. Solar demand is declining 7% as manufacturers move toward copper-based cells — but AI data centres, EVs, and semiconductor demand are absorbing the gap. The sixth consecutive annual supply deficit of 67 million ounces still exists, providing a structural price floor, even if the solar tailwind is weaker than in 2025.
What is the silver price target for Q2 2026?
The immediate technical target on a $76 breakout is $79.60. The 200-SMA at $78.12 is the structural test. JP Morgan forecasts a full-year 2026 average of $81. Bank of America targets $135 in a gold-silver ratio compression scenario. Citigroup maintains an H2 target of $110 contingent on Fed easing. The structural deficit and institutional forecast range support the case for continued recovery toward $80+ through Q2.
- Check out our free forex signals
- Follow the top economic events on FX Leaders economic calendar
- Trade better, discover more Forex Trading Strategies
- Open a FREE Trading Account
- Read our latest reviews on: Avatrade, Exness, HFM and XM
Related Articles


Sidebar rates
Related Posts
