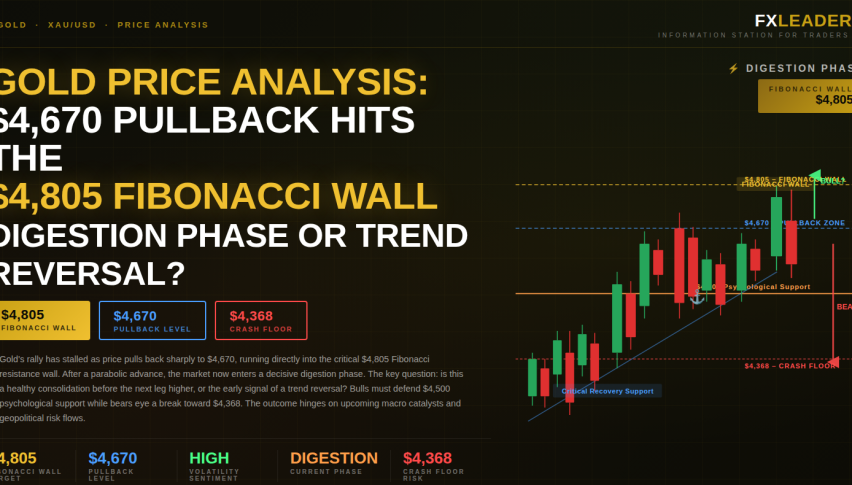
Gold Price Analysis: $4,670 Pullback Hits the $4,805 Fibonacci Wall – Digestion Phase or Trend Reversal?
XAU/USD is currently trading at around $4,670-$4,690 on April 2nd, down about 2.4% after snapping a 4-session winning...
Quick overview
- XAU/USD is trading around $4,670-$4,690, down 2.4% after a 17% rebound from March's low of $4,100.
- The recent pullback is attributed to a rebound in the US Dollar following Trump's comments on the Iran conflict.
- Central banks, including Russia, are selling gold for the first time in over 20 years to offset budget deficits, complicating the traditional view that they only buy gold.
- Trump's upcoming speech on the Iran war is expected to be a key catalyst for gold prices in the near term.
XAU/USD is currently trading at around $4,670-$4,690 on April 2nd, down about 2.4% after snapping a 4-session winning streak that lifted Gold about 17% off its March low of $4,100. The $4,805 mark where the 0.618 retracement meets the 200-day moving average has proven to be the exact sort of resistance the technical charts had predicted. The question is, is this just gold digesting its gains or the start of a slowdown.
What Broke the Rally: The Dollar’s Rebound Over Trump’s Iran Signal
Today’s pullback is largely due to a sudden uptick in the US Dollar following Trump’s latest comments that there’s no clear timeline for Iran conflict resolution. This has created the same dynamic we’ve seen all month – just as soon as traders start to get their hopes up for a ceasefire, some contradictory signal from Trump or another US official can send them scurrying back into the dollar and Treasuries as preferred safe-haven assets over non-yielding gold.
One new twist in the research – this is the first time in over 20 years that some central banks – including Russia – have started selling gold to help offset energy-driven budget deficits, which adds a note of caution to the idea that central banks only ever buy gold. The structural bid from China and India remains intact, with forecasters anticipating 750-900 tonnes of net gold purchases in 2026. However the ‘central banks only buy’ thesis is now a little less clear-cut than it was in Q1.
Trump is due to speak to the nation on the Iran war today – and it’s this one speech that will be the single most important near-term catalyst for XAU/USD.
XAU/USD Technical Analysis: Right in the Middle of Two Moving Averages
The 4-hour chart shows gold stuck in a textbook consolidation between two major technical lines.
Resistance: $4,805 (where the 0.618 Fibonacci retracement of the March decline meets the 200-day moving average confluence) – and this is a level that sellers have slapped down whenever gold has tried to breach it. A close above $4,805 would open the path to $4,995.
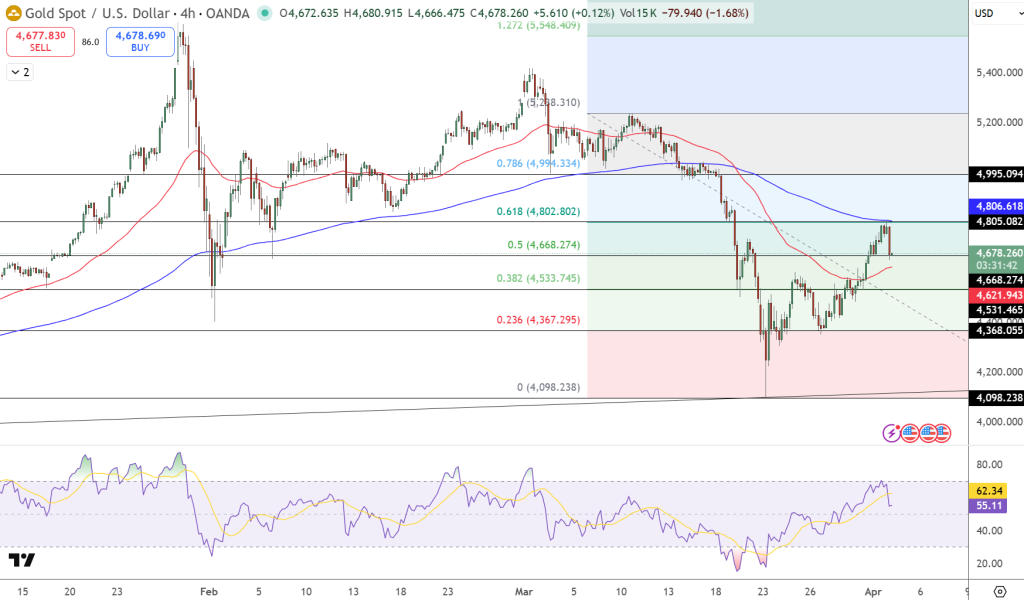
Current price: $4,670-$4,690 – right below the immediate pivot at $4,775.
Support S1: $4,620 (fifty-day moving average that’s trending upward) – the minimum level that bulls need to defend if they want to keep this recovery intact.
Long-term support: $4,531 – breaching this could send gold back down to the $4,368 March support zone to test.
The RSI at 55 confirms that the sharp bounce in gold has fizzled out but we’re still not in bearish territory. Gold is stuck in the middle of the 50-day and 200-day moving averages – which is exactly where you usually find yourself before something decides to happen.
Trade set up: Buy only on a confirmed close above $4,805 | Expect $4,995 if it happens. For the bearish scenario, if the 50-day moving average gets breached at $4,620 we can target $4,531. If you try to buy the dip, make sure your stop is below $4,620.
FAQ: Gold April Outlook – $4,805 Rejection, Trump’s Speech, and Where Central Banks Fit In
Why did gold pull back after a 17% rebound?
This $4,805 level is where the 0.618 Fibonacci retracement of the entire March decline meets the 200-day moving average – and it’s exactly where traders were positioned from above to sell gold back down. Plus a sudden uptick in the dollar due to Trump’s latest Iran comments gave traders reason to take a second look at their dollar/Treasury yields positions.
What does Trump’s April 2 speech mean for gold?
Gold is binary on this one – de-escalation signals from the speech would send traders back into riskier assets and away from the dollar, and gold could get support for its next leg up to $4,805 and beyond. Escalation talk – especially anything about the April 6 Hormuz deadline – would reinforce dollar strength and get sellers even more aggressive below $4,620.
What is the gold price target for 2026?
A few of the big banks are forecasting a pretty high gold price target – JP Morgan and UBS at $6,000-$6,300 in an optimistic scenario, driven by rate cuts and fiscal concerns. Goldman Sachs on the other hand is taking a more conservative approach at $4,900. Traders on average are at $5,150 – roughly 9% higher than current prices. But to be fair, the range is still enormously wide – which just goes to show how uncertain the macro outlook still is.
- Check out our free forex signals
- Follow the top economic events on FX Leaders economic calendar
- Trade better, discover more Forex Trading Strategies
- Open a FREE Trading Account
- Read our latest reviews on: Avatrade, Exness, HFM and XM
Related Articles


Sidebar rates
Related Posts
