Silver Price Holds Near $74 as Fragile US-Iran Ceasefire Triggers Pullback – Breakout to $78 or Drop to $72 Next?
Silver prices have been trending in a narrow range of around $73.50-$74.50 per ounce on April 9th, with relatively modest fluctuations...
Quick overview
- Silver prices are currently trading in a narrow range of $73.50-$74.50 per ounce, following a significant rise earlier in the week.
- The recent US-Iran ceasefire has reduced safe-haven demand for silver, leading to profit-taking after a 5-6% gain.
- Despite recent volatility, silver remains up over 130% year-over-year, supported by strong industrial demand and ongoing supply deficits.
- Technical analysis indicates that silver is holding above key support levels, with potential upside targets around $78.80 and $83.76.
Silver prices have been trending in a narrow range of around $73.50-$74.50 per ounce on April 9th, with relatively modest fluctuations following a sharp increase earlier in the week. As of now, spot silver is hovering around $73.90-$74.20, while futures contracts display similar levels, with a bit of intraday volatility thrown into the mix.
What’s Behind Silver’s Recent Consolidation?
The US-Iran ceasefire has had a positive impact on easing safe-haven demand and driving down oil prices – and in response, people are cashing in on silver’s 5-6% gain from April 8th. While the ceasefire has certainly helped, the ongoing tensions in the Strait of Hormuz and the looming industrial supply deficits continue to provide a solid foundation for the metal.
What’s Been Happening with Silver Recently and How Is the Ceasefire Impacting the Market
Silver had a wild ride on April 8th, rising by as much as 5-6% (or a bit more in some reports) to near $76-$77 intraday, following the US-Iran ceasefire agreement which was good news for everyone but also generated some lingering uncertainty. This news weakened the US dollar a bit, boosted risk appetite, and, with precious metals doing well overall, gave silver a nice little boost.
Earlier in the week (around April 7th), prices had been consolidating in the low $70s after a pretty volatile March-April period. Silver’s still a long way off from its all-time high of around $121.60-$121.64, which it hit in late January 2026 – a roughly 40% drop from that peak. And, of course, it’s still got a ways to go before we see the end of the current pullback, which is being driven by profit-taking, shifting expectations, and earlier inflation/rate concerns.
On a year-over-year basis, though, silver is still doing quite well (up by over 130% in some measures) thanks to the broader precious metals momentum and the ongoing strength in industrial demand.
What’s Driving the Market Today
- Politics: The fragile US-Iran ceasefire has made the safe-haven demand go down a bit, and contributed to lower oil prices, but people are still being cautious due to the ongoing regional activity. Silver often moves with gold but tends to amplify its moves – partly because it’s both a monetary and industrial metal.
- Macro Factors: We’re also keeping an eye on US inflation data, Federal Reserve signals, and the dollar. The FOMC minutes highlighted some concerns over potential sustained inflation from energy shocks, but there are still expectations for limited rate cuts. All this has made for a weaker dollar and declining bond yields, which has helped the rally.
- Industrial and Supply Dynamics: Silver is benefiting from strong demand in solar, electronics, and healthcare sectors. On top of that, we’ve got ongoing global supply deficits and low COMEX inventory levels providing some structural support – even when the metal does go through corrections. Central banks are more active in gold, but their activity still has an indirect impact on the broader precious metals complex.
What’s the Gold-Silver Ratio and Broader Context Looking Like
The gold-silver ratio is sitting at around 62-64, which means silver has underperformed gold on a relative basis during this recent correction. Historically, when the ratio is elevated, it’s a good sign that silver might outperform gold in the next rally.
Silver has been pretty volatile in 2026, with big swings tied to geopolitical events and industrial demand cycles. Analysts think that silver might be in for some more range-bound trading (e.g. $60-$80) in the near term, but the longer-term outlook is still pretty bullish thanks to supply shortages and economic hedging needs. Some forecasts are even calling for an average price of around $81 for the year.
What Does the Technical Analysis Say – Silver Holds Support Above Trendline
Silver (XAG/USD) is currently trading near $74.05, holding onto a rising trendline that has been guiding the recovery from the $61 low. This is a gradual shift from bearish pressure into a corrective uptrend, with higher lows consistently forming.
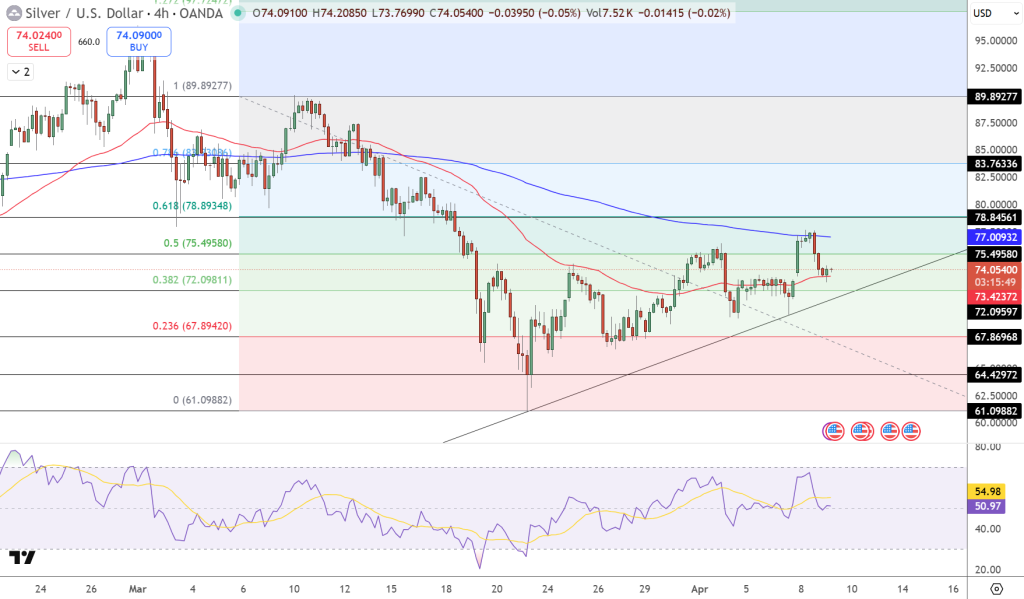
The price is hovering around the 0.382 Fibonacci level at $72.09 after rejecting near the $77.00-$78.80 resistance zone, which is also in line with the 100-SMA. The recent candles show smaller bodies and wicks on both sides, which is a sign of indecision after the pullback from $77. This means the market is compressing before the next directional move.
Key Silver Price Levels to Watch (April 9, 2026)
| Level Type | Price Level | Significance |
| Immediate Resistance | $75.50 | 0.5 Fibonacci level |
| Major Upside Target | $78.80 – $83.76 | Next extension zones |
| Key Support | $73.24 – $72.10 | Rising trendline + support zone |
| Deeper Support | $67.86 | 0.236 Fibonacci |
The 50-SMA near $73.40 is acting as immediate support, while a break below $72.00 could expose $67.86 (0.236 Fib). On the upside, reclaiming $75.50 (0.5 Fib) would start opening the path toward $78.84, and possibly even $83.76.
The Relative Strength Index (RSI) is near 50-55, reflecting neutral momentum with room for expansion in either direction.
Trade Idea: Buy above $75.50, targeting $78.80 and $83.70, with a stop below $72.80.
- Check out our free forex signals
- Follow the top economic events on FX Leaders economic calendar
- Trade better, discover more Forex Trading Strategies
- Open a FREE Trading Account
- Read our latest reviews on: Avatrade, Exness, HFM and XM
Related Articles


Sidebar rates
Related Posts
