Prices Forecast: Technical Analysis
For today, the predicted closing price for USD/SGD is 1.2920, with a range of 1.2900 to 1.2940. Looking ahead to the week, the forecasted closing price is 1.2935, with a range of 1.2905 to 1.2955. The technical indicators suggest a neutral to slightly bullish sentiment, as the RSI is at 51.5252, indicating that the market is neither overbought nor oversold. The ATR of 0.0041 suggests low volatility, which may lead to a more stable price movement within the predicted range. The pivot point at 1.29 indicates that the price is currently trading above this level, which is a bullish sign. Resistance levels at 1.29 may act as a barrier, while support levels will provide a cushion against downward movements. Overall, the market sentiment appears cautiously optimistic, with potential for upward movement if the price maintains above the pivot.
Fundamental Overview and Analysis
The USD/SGD has shown a steady upward trend recently, reflecting a stronger US dollar against the Singapore dollar. Factors influencing this trend include economic data releases from the US, which have been relatively positive, boosting investor confidence. Additionally, the Singapore economy is facing challenges, including slower growth forecasts, which may weigh on the SGD. Investor sentiment appears to be leaning towards the USD, given its recent performance and the Federal Reserve’s stance on interest rates. Opportunities for growth in the USD/SGD pair may arise from further economic recovery in the US, while risks include potential geopolitical tensions and changes in monetary policy. Currently, the asset seems fairly valued, but any significant shifts in economic indicators could lead to volatility.
Outlook for USD/SGD
The future outlook for USD/SGD remains cautiously optimistic, with potential for gradual appreciation in the coming months. Current market trends indicate a stable price movement, supported by historical price behavior and low volatility. Key factors likely to influence the price include ongoing economic conditions in both the US and Singapore, as well as any regulatory changes that may arise. In the short term (1 to 6 months), we could see the price range between 1.2900 and 1.3000, depending on economic data releases. Long-term forecasts (1 to 5 years) suggest a potential upward trend, assuming continued economic recovery and stability. However, external factors such as geopolitical events or market crashes could significantly impact this outlook, necessitating close monitoring of global developments.
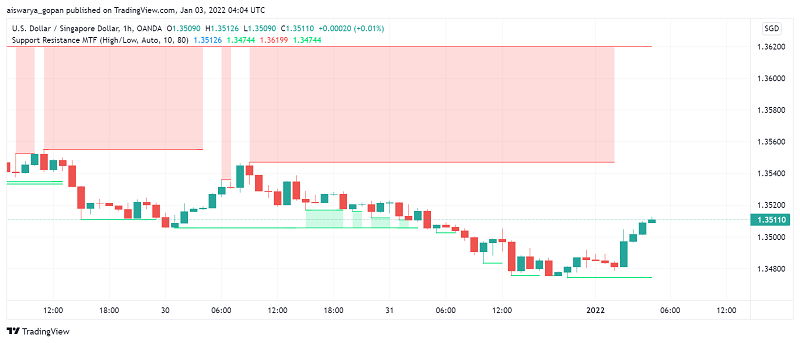
Technical Analysis
Current Price Overview: The current price of USD/SGD is 1.2911, which is slightly above the previous close of 1.2905. Over the last 24 hours, the price has shown a slight upward movement with low volatility, indicating a stable market environment. Support and Resistance Levels: The support levels are at 1.2900, 1.2890, and 1.2880, while resistance levels are at 1.2920, 1.2930, and 1.2940. The pivot point is at 1.29, and since the price is trading above this level, it suggests a bullish sentiment. Technical Indicators Analysis: The RSI is at 51.5252, indicating a neutral trend. The ATR is 0.0041, suggesting low volatility. The ADX is at 19.1872, indicating a weak trend. The 50-day SMA is at 1.2905, and the 200-day EMA is at 1.2817, showing no crossover currently. Market Sentiment & Outlook: The sentiment is currently neutral to slightly bullish, as the price is above the pivot point, and the RSI indicates no overbought conditions.
Forecasting Returns: $1,000 Across Market Conditions
The table below outlines potential investment scenarios for USD/SGD, providing insights into expected price changes and estimated values of a $1,000 investment under different market conditions.
| Scenario | Price Change | Value After 1 Month |
|---|---|---|
| Bullish Breakout | +2% to ~$1.315 | ~$1,020 |
| Sideways Range | 0% to ~$1.291 | ~$1,000 |
| Bearish Dip | -2% to ~$1.267 | ~$980 |
FAQs
What are the predicted price forecasts for the asset?
The predicted daily closing price for USD/SGD is 1.2920, with a weekly forecast of 1.2935. The price is expected to range between 1.2900 to 1.2940 daily and 1.2905 to 1.2955 weekly.
What are the key support and resistance levels for the asset?
Key support levels for USD/SGD are at 1.2900, 1.2890, and 1.2880. Resistance levels are at 1.2920, 1.2930, and 1.2940, with the pivot point at 1.29 indicating bullish sentiment.
What are the main factors influencing the asset’s price?
The asset’s price is influenced by economic data from the US and Singapore, investor sentiment towards the USD, and potential geopolitical events. Recent positive economic indicators from the US have strengthened the USD against the SGD.
What is the outlook for the asset in the next 1 to 6 months?
In the short term, USD/SGD is expected to range between 1.2900 and 1.3000, influenced by ongoing economic conditions. The outlook remains cautiously optimistic, with potential for gradual appreciation.
What are the risks and challenges facing the asset?
Risks include potential geopolitical tensions, changes in monetary policy, and market volatility. These factors could significantly impact the USD/SGD price, necessitating close monitoring of global developments.
Disclaimer
In conclusion, while the analysis provides a structured outlook on the asset’s potential price movements, it is essential to remember that financial markets are inherently unpredictable. Conducting thorough research and staying informed about market trends and economic indicators is crucial for making informed investment decisions.