Gold Bounces Off the 100 SMA Again, As USD Weakens
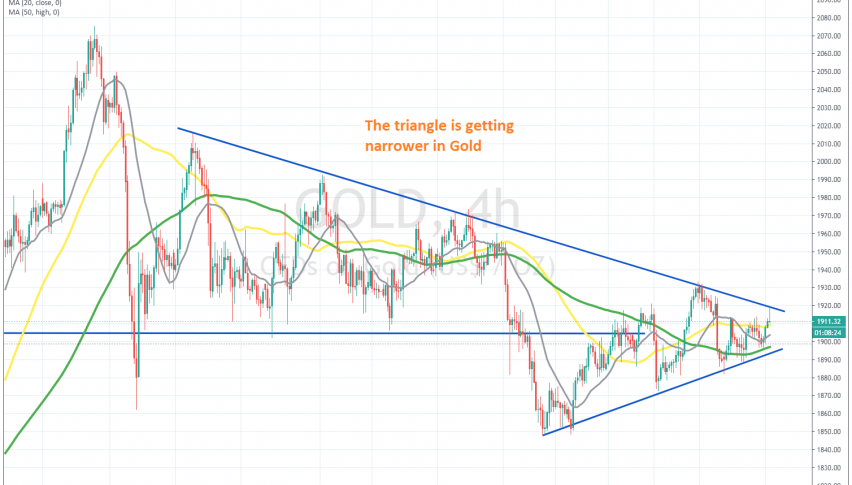
Gold failed bot at the bottom and at the top of the triangle today
GOLD has been declining since early August. The larger trend has been bullish for two years and continues to remains so, especially after the surge of this year, as the coronavirus restrictions have been hurting the global economy, probably more so than the 2008 financial crisis.
Gold climbed above $2,000 in summer, which makes it the record high, but reversed down in the first week of August and since then, it has been making lower highs. This is a sign that the trend is changing in crude Oil, with sellers jumping in earlier every time.
But, as we said, the trend remains bullish in the long term charts. The lows have also been getting higher for about a month, so Gold has been forming a triangle since the last week of September and the triangle is getting narrower. The 100 SMA (green) has also turned into support on the H4 chart now.
Buyers tested the top of the triangle today, but failed and the price has retraced lower, So the triangle is still in play and w will try to trade it, selling at the top. We will wait a bit longer to see if the price tries the top side again and if we see a second failure, we will go short in Gold, targeting the bottom of the triangle.
- Check out our free forex signals
- Follow the top economic events on FX Leaders economic calendar
- Trade better, discover more Forex Trading Strategies
- Open a FREE Trading Account
- Read our latest reviews on: Avatrade, Exness, HFM and XM
Related Articles


Sidebar rates
Related Posts
