Support & Resistance Levels For GBP/USD?
As I mentioned yesterday, GBP is being quite stubborn. Despite the political uncertainties in the UK regarding Brexit and a softening econo
As I mentioned yesterday, GBP is being quite stubborn. Despite the political uncertainties in the UK regarding Brexit and a softening economy, it keeps showing resilience.
It has climbed nearly 150 pips since this time yesterday and the pullbacks have been minimal, which means that the buying pressure is obvious for this pair, at least in the short term. Let’s have a look to see where the support & resistance levels are, so we can use them for our trading today if we do see a good chart setup.
Resistance Support
1 – 1.3040-50 (Medium – Resistance in May) 1 – 1.30 (Strong – Big round number)
2 – 1.13080 (Medium – previous resistance) 2 – 1.2980 (Medium – Buffer for 1.30)
3 – 1.31 (Strong – Big round number) 3 – 1.2940-50 (Strong – 100 SMA on h4 chart)
5 – 1.3120-30 (Strong – Resistance last month) 4 – 1.29 (Strong – Big round number)
 You can find resistance beyond this chart's history
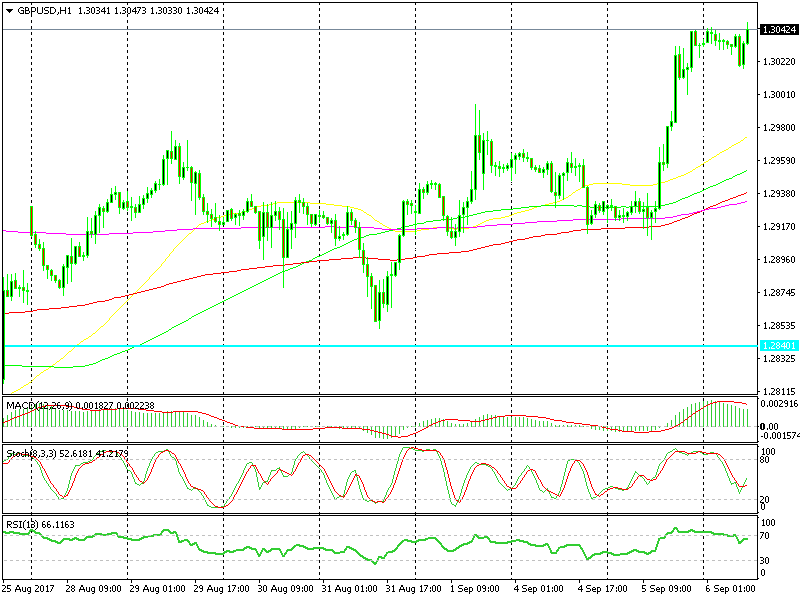
The 1.30 level in this forex pair broke without much resistance and I was hoping to get a trade on the long side at this level, had the price dipped down there this morning. But sellers were too weak to push down there and 1.3020 became the reversing point. Anyway, I will be looking at the price action around these levels to see if I can get a decent trade in this forex pair today.
- Check out our free forex signals
- Follow the top economic events on FX Leaders economic calendar
- Trade better, discover more Forex Trading Strategies
- Open a FREE Trading Account
- Read our latest reviews on: Avatrade, Exness, HFM and XM
Related Articles


Sidebar rates
Related Posts
