Soybeans are a popular ingredient in vegetarian and vegan cuisine, because they are naturally high in protein. Soy milk is a cow’s milk substitute, which is both vegan and lactose-free, and soy-sauce is a popular and essential ingredient in East Asian cuisine. The market value of soy foods in the United States is expected to reach 16.75 billion US dollars this year, from 4.6 Billion dollars in 2014.
Soybeans are among the major oilseed and protein meal products. The beans are grown as a crop in Eastern Asia and they are also produced in Western agriculture, as a source of both oil and protein. The main producers of soybeans are Brazil and the United States, but China leads the soybean oil production worldwide.
In the past few years, annual soybean production in the United States has increased to over four billion bushels. Last year, the US produced the highest volume of soybeans of any country, at around 123.66 million metric tons. In 2018-2019, the total volume of soybean imports was recorded as 153.31 million metric tons globally. China was the leading importer of soybeans, with an annual import of 92 million metric tons. The prices of Soybeans are affected by many factors, including supply and demand, US Production, the strength of the US dollar, the demand from emerging markets and ethanol subsidies.
Why Look at Historic Soybean Prices?
There are manifold factors involved in the determination of a bullish bias in soybeans. Let’s explore them one by one, in order to forecast the soybean prices.
US Production:
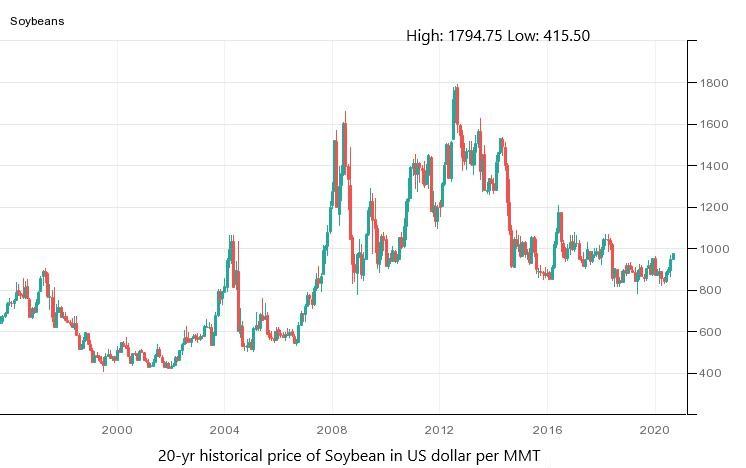
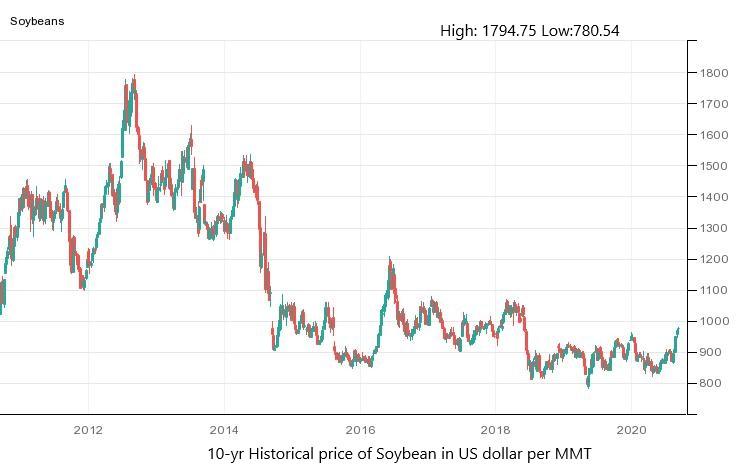
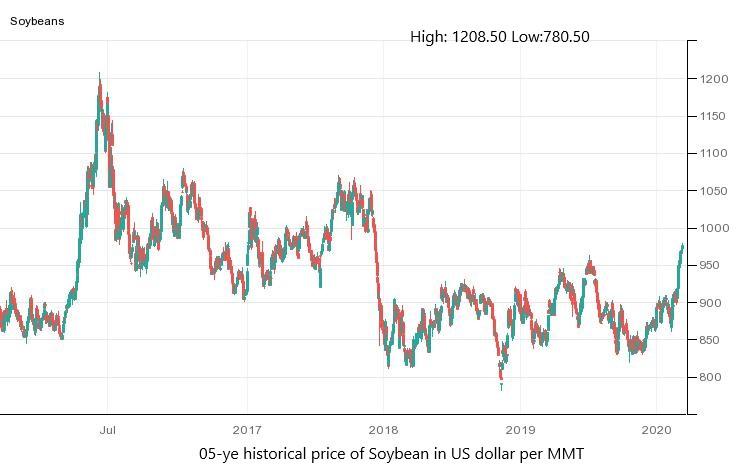
The US is considered the biggest producer and exporter of soybeans, with a total production of 3.558 billion bushels in 2019. However, the production in 2019 was less than the previous year, which amounted to 4.428 billion bushels. The supply shocks, such as adverse weather conditions, hurricanes or drought in key American soybean-producing states, can impact production, thereby limiting the volume of soybeans available in the global market, which can push prices up. Given the two-year production data in the charts above, it can be said that in 2019, the prices surged from the previous year’s level.
Strength of the US Dollar:
Soybean prices are quoted in US dollars, just like many other commodities. This means that when the US dollar is strong, soybean producers receive lower pay-outs for their production and vice versa. Recently, the easy monetary policy from the US Federal Reserve has kept the US dollar weak, and the soybean prices have gained as a result. The US central bankers have provided hints that the policy is likely to continue for an extended period of time, in order to support consumer borrowing and spending.
Demand for the Emerging Market:
The emerging economies, like India and South Africa, have started to increase soybean utilization. The demand for livestock feeds and oil increases as the developing world becomes richer and the populations grow. The increased demand could raise the prices of soybean products, if the supply remains constant in the coming years.
Ethanol Subsidies:
The US government provides subsidies to corn farmers, in order to boost ethanol production. If the subsidies for corn were to end, more farmers would choose to grow soybeans, and in this case, the supply of soybeans would increase, bringing the prices down and vice versa.
China’s Import Volume:
China is the biggest utilizer and importer of soybeans. In 2019, China imported 92 MMT of soybeans, while the global soybean import volume was recorded as 153 MMT. Brazil is the main exporter of soybeans, and the export to China from Brazil in 2019 was recorded as 20.5 billion.
According to the Phase 1 trade deal between the US and China, the dragon nation has agreed to import over 43 MMT of soybeans in 2020, in order to fulfill its trade commitments. However, from January to May, China had only bought 9 MMT of US soybeans, while having bought over 22 MMT from Brazil. As a large portion of US soybean imports to China is yet to be fulfilled, in order to meet the Phase 1 trade deal commitments in the second half of the year, the prices of US Soybeans will rise in the coming months.
Coronavirus:
The spread of the coronavirus pandemic has affected the global food supply and distribution to some extent, as the major soybean producing areas around the world, trade policies, political factors and the cancellation of policies have affected the soybean market. All of this, in turn, has affected China’s soybean supply. The main user of soybeans is China, which uses 60% of the global soybean production every year. However, in the first quarter of 2020, the soybean prices suffered, due to the coronavirus pandemic, as the demand decreased, ultimately leading to low prices. However, the recovery of China’s domestic economic activity has now resulted in the normalization of market prices.
