Prices Forecast: Technical Analysis
For today, Ankr is predicted to close at approximately $0.0035, with a range between $0.0033 and $0.0037. Looking ahead to the week, the expected closing price is around $0.0036, with a potential range of $0.0034 to $0.0038. The technical indicators suggest a bearish trend, as indicated by the RSI value of 28.68, which is well below the neutral level of 50, signaling oversold conditions. The ATR remains low at 0.0002, indicating low volatility, which may limit significant price movements in the short term. The ADX at 29.27 suggests a strengthening bearish trend, while the SMA and EMA values indicate that the price is below both averages, reinforcing the bearish outlook. The market sentiment is cautious, with recent economic data showing inflation concerns that could impact investor confidence. Overall, the combination of these indicators suggests that Ankr may continue to face downward pressure in the near term.
Fundamental Overview and Analysis
Ankr has recently experienced a downward trend, with prices declining from $0.0076 to the current level of $0.0037. Factors influencing this decline include increased competition in the blockchain space and regulatory uncertainties that have affected investor sentiment. Market participants are currently cautious, as reflected in the low RSI and bearish price action. Despite these challenges, Ankr has opportunities for growth through potential partnerships and technological advancements in decentralized infrastructure. However, risks remain, including market volatility and the need for continuous innovation to stay competitive. Currently, Ankr appears undervalued based on its technological potential and market position, suggesting a possible rebound if market conditions improve.
Outlook for Ankr
The future outlook for Ankr remains uncertain, with current market trends indicating a bearish sentiment. Historical price movements show significant volatility, and the recent decline suggests that further downward pressure may occur in the short term. Key factors influencing Ankr’s price will include macroeconomic conditions, regulatory developments, and technological advancements in the blockchain sector. In the next 1 to 6 months, prices may stabilize around the $0.0035 mark if market sentiment improves. Looking at a longer-term horizon of 1 to 5 years, Ankr could see growth if it successfully scales its operations and captures market share. However, external factors such as geopolitical tensions and market crashes could significantly impact its price trajectory.
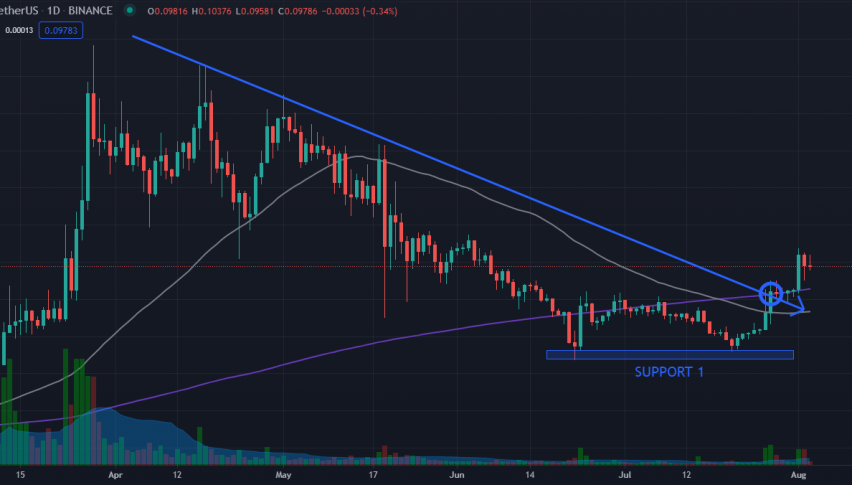
Technical Analysis
Current Price Overview: The current price of Ankr is $0.0037, which is a decrease from the previous close of $0.0076. Over the last 24 hours, the price has shown a downward trend with low volatility, indicating a lack of strong buying or selling pressure. Support and Resistance Levels: The identified support levels are $0.0033, $0.0035, and $0.0036, while resistance levels are at $0.0038, $0.0040, and $0.0042. The pivot point is at $0.0037, and since the price is currently below this level, it indicates a bearish sentiment. Technical Indicators Analysis: The RSI is at 28.68, suggesting a bearish trend as it indicates oversold conditions. The ATR is low at 0.0002, indicating low volatility. The ADX at 29.27 shows a strengthening bearish trend. The 50-day SMA and 200-day EMA are both above the current price, indicating a bearish crossover. Market Sentiment & Outlook: The sentiment is currently bearish, as indicated by the price action below the pivot point, the low RSI, and the bearish ADX direction.
Forecasting Returns: $1,000 Across Market Conditions
The table below outlines potential investment scenarios for Ankr, providing insights into expected price changes and estimated values for a $1,000 investment under different market conditions.
| Scenario | Price Change | Value After 1 Month |
|---|---|---|
| Bullish Breakout | +10% to ~$0.0041 | ~$1,100 |
| Sideways Range | 0% to ~$0.0037 | ~$1,000 |
| Bearish Dip | -10% to ~$0.0033 | ~$900 |
FAQs
What are the predicted price forecasts for the asset?
The predicted daily closing price for Ankr is approximately $0.0035, with a range between $0.0033 and $0.0037. For the weekly forecast, the expected closing price is around $0.0036, with a potential range of $0.0034 to $0.0038.
What are the key support and resistance levels for the asset?
The key support levels for Ankr are at $0.0033, $0.0035, and $0.0036. The resistance levels are identified at $0.0038, $0.0040, and $0.0042, with the pivot point at $0.0037.
What are the main factors influencing the asset’s price?
The main factors influencing Ankr’s price include market competition, regulatory changes, and technological advancements. Recent economic data showing inflation concerns also play a significant role in shaping investor sentiment.
What is the outlook for the asset in the next 1 to 6 months?
In the next 1 to 6 months, Ankr’s price may stabilize around the $0.0035 mark if market sentiment improves. However, continued bearish trends could lead to further declines if external factors remain unfavorable.
What are the risks and challenges facing the asset?
Ankr faces risks such as market volatility, competition, and the need for continuous innovation. Regulatory hurdles could also impact its growth potential and market acceptance.
Disclaimer
In conclusion, while the analysis provides a structured outlook on the asset’s potential price movements, it is essential to remember that financial markets are inherently unpredictable. Conducting thorough research and staying informed about market trends and economic indicators is crucial for making informed investment decisions.