Prices Forecast: Technical Analysis
For today, Ankr is predicted to close at approximately $0.005, with a trading range expected between $0.0048 and $0.0052. Looking ahead to the week, the forecasted closing price is around $0.0052, with a potential range of $0.0047 to $0.0055. The technical indicators suggest a neutral trend, with the RSI at 49.38 indicating a balance between buying and selling pressure. The ATR shows low volatility at 0.0002, suggesting limited price movement in the near term. The ADX is at 32.16, indicating a strengthening trend, albeit not strongly directional. The price is currently below the pivot point of $0.01, which may act as a resistance level. If the price can break above this level, it could signal a bullish reversal. However, the recent price action has been relatively stable, indicating that traders should remain cautious. Overall, the technical indicators suggest a potential for slight upward movement if buying pressure increases.
Fundamental Overview and Analysis
Ankr has recently experienced a downward trend, with prices fluctuating around the $0.005 mark. Factors influencing its value include the growing demand for decentralized cloud computing solutions and the overall sentiment in the cryptocurrency market. Investor sentiment appears cautious, with many awaiting clearer signals of market recovery. The asset’s scalability and potential partnerships could drive future growth, but competition from other blockchain solutions poses a challenge. Regulatory changes in the crypto space may also impact Ankr’s adoption and market performance. Currently, Ankr seems fairly priced given its recent performance and market conditions, but any significant technological advancements could enhance its valuation. Overall, while there are opportunities for growth, investors should be aware of the risks associated with market volatility and competition.
Outlook for Ankr
The future outlook for Ankr appears cautiously optimistic, with potential for gradual price recovery. Current market trends indicate a stabilization phase, with historical price movements showing a tendency to bounce back from recent lows. Key factors influencing Ankr’s price will include broader economic conditions, technological advancements, and regulatory developments. In the short term (1 to 6 months), prices may range from $0.0045 to $0.0065, depending on market sentiment and demand. Long-term projections (1 to 5 years) suggest that if Ankr can capitalize on its technological advantages, it could see significant growth, potentially reaching prices above $0.01. However, external factors such as market crashes or geopolitical issues could hinder this growth. Investors should remain vigilant and adapt their strategies based on market developments.
Technical Analysis
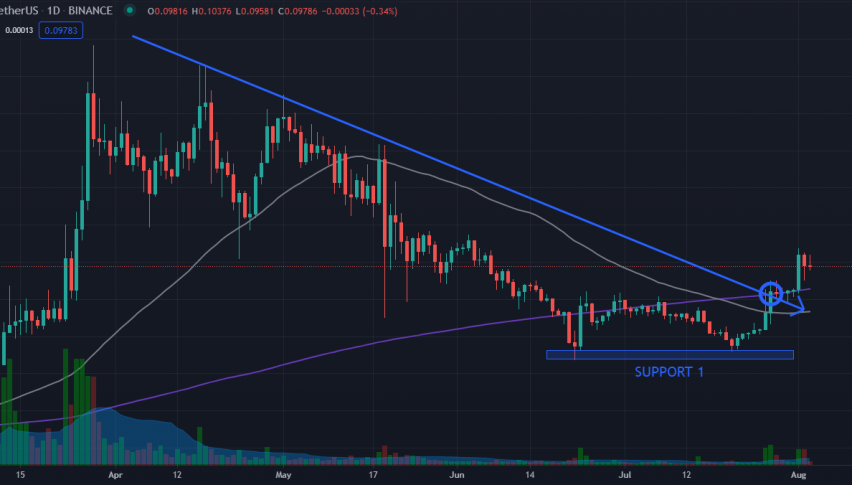
Current Price Overview: The current price of Ankr is $0.005, which is a decrease from the previous close of $0.005. Over the last 24 hours, the price has shown minimal volatility, indicating a stable trading environment with no significant price movements. Support and Resistance Levels: The identified support levels are $0.0042, $0.0044, and $0.0045, while resistance levels are at $0.01, $0.01, and $0.01. The asset is currently trading below the pivot point of $0.01, suggesting a bearish sentiment. Technical Indicators Analysis: The RSI is at 49.38, indicating a neutral trend. The ATR is low at 0.0002, suggesting low volatility. The ADX is at 32.16, indicating a strengthening trend. The 50-day SMA is at $0.0051, and the 200-day EMA is at $0.0053, showing no significant crossover at this time. Market Sentiment & Outlook: The current sentiment appears neutral, with price action hovering around the pivot point. The RSI and ADX suggest a potential for upward movement if buying pressure increases.
Forecasting Returns: $1,000 Across Market Conditions
The table below outlines potential investment scenarios for Ankr, providing insights into expected returns based on different market conditions.
| Scenario | Price Change | Value After 1 Month |
|---|---|---|
| Bullish Breakout | +10% to ~$0.0055 | ~$1,100 |
| Sideways Range | 0% to ~$0.005 | ~$1,000 |
| Bearish Dip | -10% to ~$0.0045 | ~$900 |
FAQs
What are the predicted price forecasts for the asset?
The predicted daily closing price for Ankr is approximately $0.005, with a range of $0.0048 to $0.0052. For the weekly forecast, the expected closing price is around $0.0052, with a potential range of $0.0047 to $0.0055.
What are the key support and resistance levels for the asset?
The key support levels for Ankr are at $0.0042, $0.0044, and $0.0045. The resistance levels are identified at $0.01, indicating a significant barrier for upward price movement.
What are the main factors influencing the asset’s price?
Factors influencing Ankr’s price include the demand for decentralized cloud computing solutions, investor sentiment, and potential regulatory changes. Additionally, competition from other blockchain solutions may impact its market performance.
What is the outlook for the asset in the next 1 to 6 months?
In the next 1 to 6 months, Ankr’s price is expected to range from $0.0045 to $0.0065, depending on market sentiment and demand. The outlook remains cautiously optimistic, with potential for gradual recovery.
What are the risks and challenges facing the asset?
Risks facing Ankr include market volatility, competition from other blockchain technologies, and potential regulatory hurdles. Investors should remain aware of these challenges when considering their investment strategies.
Disclaimer
In conclusion, while the analysis provides a structured outlook on the asset’s potential price movements, it is essential to remember that financial markets are inherently unpredictable. Conducting thorough research and staying informed about market trends and economic indicators is crucial for making informed investment decisions.