Prices Forecast: Technical Analysis
For today, Chainlink is predicted to close at approximately **$21.50**, with a range between **$20.50** and **$22.50**. Looking ahead to the week, the expected closing price is around **$22.00**, with a potential range of **$21.00** to **$23.00**. The current RSI of **53.91** indicates a neutral trend, suggesting that Chainlink is neither overbought nor oversold, which supports the forecasted price stability. The ATR of **0.4363** indicates moderate volatility, allowing for potential price fluctuations within the predicted ranges. The ADX value of **14.26** suggests a weak trend, reinforcing the idea of a sideways movement rather than a strong directional shift. Given these indicators, traders should be cautious but can look for buying opportunities if prices approach the lower end of the forecast range. Overall, the technical indicators suggest a balanced market sentiment, with potential for slight upward movement if buying pressure increases.
Fundamental Overview and Analysis
Chainlink has recently shown resilience in its price trends, maintaining a stable range despite market fluctuations. Factors influencing its value include increasing demand for decentralized finance (DeFi) applications and the growing adoption of smart contracts. Investor sentiment appears cautiously optimistic, with many viewing Chainlink as a critical infrastructure provider in the blockchain space. Opportunities for future growth are significant, particularly as more projects integrate Chainlink’s oracles for real-world data. However, challenges such as competition from other oracle solutions and regulatory scrutiny could impact its market position. Currently, Chainlink’s valuation seems fair, considering its utility and market demand, but any significant price spikes could lead to overvaluation. Overall, the asset’s fundamentals remain strong, but market participants should remain vigilant regarding external pressures.
Outlook for Chainlink
The future outlook for Chainlink appears positive, with ongoing trends in DeFi and blockchain technology likely to drive demand. Current market trends indicate a potential for gradual price increases, supported by historical price movements that show resilience during downturns. Key factors influencing Chainlink’s price in the near future include technological advancements and broader market acceptance of blockchain solutions. In the short term (1 to 6 months), prices may range from **$21.00** to **$25.00**, depending on market conditions and investor sentiment. Long-term forecasts (1 to 5 years) suggest a bullish trajectory, with potential prices reaching **$30.00** or higher as adoption increases. However, external factors such as regulatory changes or market volatility could significantly impact these projections. Investors should consider these dynamics when making decisions.
Technical Analysis
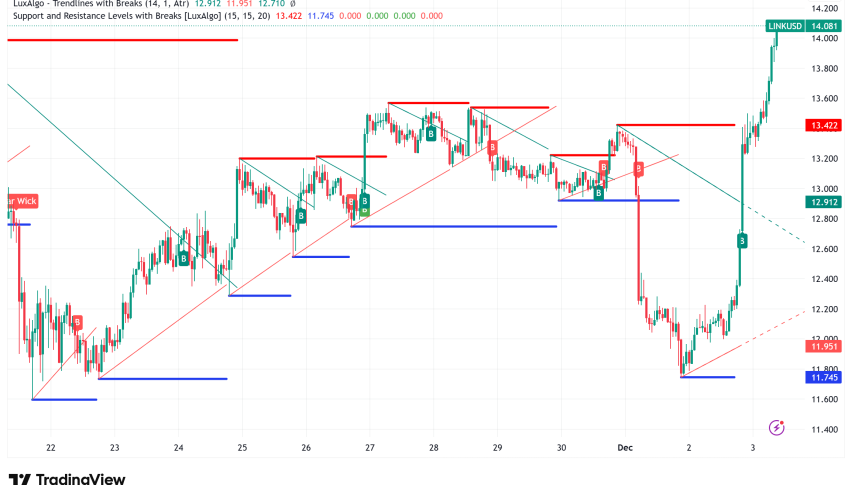
**Current Price Overview:** The current price of Chainlink is **$21.00**, which is slightly lower than the previous close of **$21.0859**. Over the last 24 hours, the price has shown moderate volatility, with notable fluctuations but no significant trend reversal.
**Support and Resistance Levels:** Key support levels are at **$20.50**, **$20.00**, and **$19.50**, while resistance levels are at **$22.50**, **$23.00**, and **$23.50**. The pivot point is currently not available, indicating uncertainty in the market direction.
**Technical Indicators Analysis:** The RSI at **53.91** suggests a neutral trend, indicating neither bullish nor bearish momentum. The ATR of **0.4363** reflects moderate volatility, while the ADX at **14.26** indicates a weak trend. The 50-day SMA and 200-day EMA are not provided, but their crossover would typically indicate a significant trend change.
**Market Sentiment & Outlook:** Sentiment appears neutral, with price action hovering around the pivot point. The RSI indicates stability, while the ADX suggests a lack of strong directional movement. Overall, traders should remain cautious and look for potential buying opportunities.
Forecasting Returns: $1,000 Across Market Conditions
The table below outlines potential investment scenarios for Chainlink, providing insights into expected returns based on different market conditions. Investors should consider these scenarios when deciding whether to invest $1,000 in Chainlink.
| Scenario | Price Change | Value After 1 Month |
|---|---|---|
| Bullish Breakout | +10% to ~$23.10 | ~$1,100 |
| Sideways Range | 0% to ~$21.00 | ~$1,000 |
| Bearish Dip | -10% to ~$18.90 | ~$900 |
FAQs
What are the predicted price forecasts for the asset?
The predicted daily closing price for Chainlink is approximately **$21.50**, with a range between **$20.50** and **$22.50**. For the weekly forecast, the expected closing price is around **$22.00**, with a potential range of **$21.00** to **$23.00**.
What are the key support and resistance levels for the asset?
Key support levels for Chainlink are at **$20.50**, **$20.00**, and **$19.50**. Resistance levels are identified at **$22.50**, **$23.00**, and **$23.50**.
What are the main factors influencing the asset’s price?
Factors influencing Chainlink’s price include increasing demand for DeFi applications, technological advancements, and investor sentiment. Additionally, competition from other oracle solutions and regulatory scrutiny could impact its market position.
What is the outlook for the asset in the next 1 to 6 months?
In the short term, Chainlink’s price is expected to range from **$21.00** to **$25.00**, depending on market conditions. Long-term forecasts suggest a bullish trajectory, with potential prices reaching **$30.00** or higher.
What are the risks and challenges facing the asset?
Risks facing Chainlink include competition from other oracle solutions, market volatility, and regulatory hurdles. Investors should remain vigilant regarding these challenges as they could impact Chainlink’s market position.
Disclaimer
In conclusion, while the analysis provides a structured outlook on the asset’s potential price movements, it is essential to remember that financial markets are inherently unpredictable. Conducting thorough research and staying informed about market trends and economic indicators is crucial for making informed investment decisions.