Prices Forecast: Technical Analysis
For today, we predict Stellar (XLM) will close at approximately $0.2365, with a trading range between $0.2320 and $0.2400. Looking ahead to the week, we anticipate a closing price of around $0.2400, with a potential range of $0.2350 to $0.2450. The recent Relative Strength Index (RSI) of 63.78 indicates that Stellar is in a bullish trend, suggesting upward momentum. The Average True Range (ATR) of 0.0197 indicates moderate volatility, which supports our forecast of price fluctuations within the predicted range. The pivot point at $0.24 suggests that if Stellar trades above this level, it may continue to rise, while trading below could indicate a pullback. The support levels at $0.22 and $0.21 provide a safety net for buyers, while resistance at $0.25 and $0.26 could cap any upward movement. Overall, the technical indicators suggest a bullish sentiment, supported by recent positive price action.
Fundamental Overview and Analysis
Stellar has shown a consistent upward trend recently, with the price moving from $0.2069 to the current $0.2332. Factors influencing this growth include increased adoption of blockchain technology and positive investor sentiment towards cryptocurrencies. The upcoming economic data releases, particularly the UK retail sales figures, could impact market sentiment and indirectly affect Stellar’s price. Investors are optimistic about Stellar’s potential for scalability and partnerships, which could drive future growth. However, risks such as regulatory scrutiny and market volatility remain significant challenges. Currently, Stellar appears fairly priced, considering its recent performance and market conditions. The balance of supply and demand is favorable, but any negative news could quickly shift sentiment.
Outlook for Stellar
The outlook for Stellar remains positive, with expectations of continued growth driven by technological advancements and market adoption. Current trends indicate a bullish sentiment, with potential price movements influenced by macroeconomic factors and regulatory developments. In the short term (1 to 6 months), we expect Stellar to maintain its upward trajectory, potentially reaching prices between $0.25 and $0.30. Long-term (1 to 5 years), Stellar could see significant growth, especially if it successfully expands its partnerships and use cases. However, external factors such as geopolitical tensions or major market corrections could impact this forecast. Overall, the market appears to be leaning towards a bullish outlook for Stellar, provided it can navigate the challenges ahead.
Technical Analysis
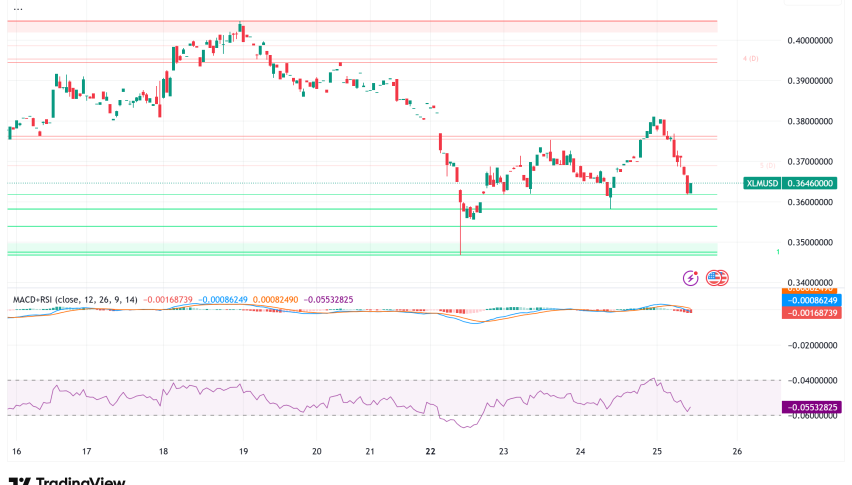
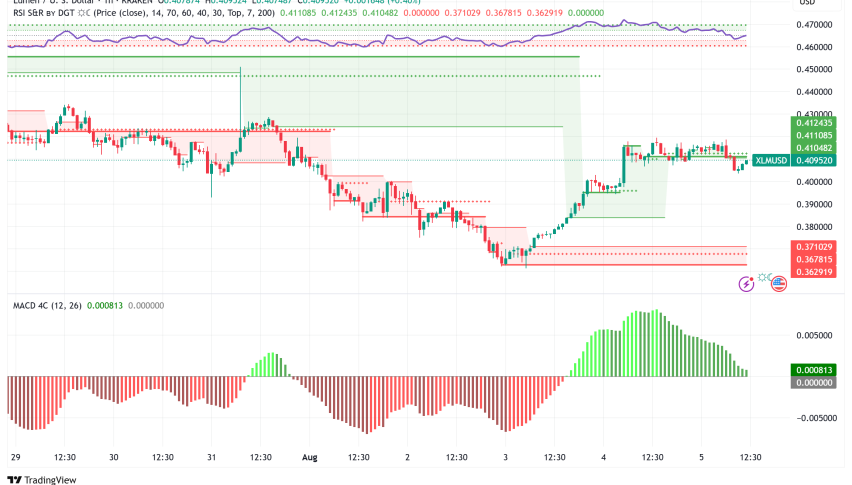
Current Price Overview: The current price of Stellar is $0.2332, which is slightly above the last closing price of $0.2332. Over the last 24 hours, the price has shown a slight upward trend with moderate volatility, indicating a stable market environment. Support and Resistance Levels: Key support levels are at $0.22, $0.21, and $0.20, while resistance levels are at $0.25, $0.26, and $0.27. The pivot point is at $0.24, and since the price is currently above this level, it suggests a bullish sentiment. Technical Indicators Analysis: The RSI is at 63.78, indicating a bullish trend. The ATR of 0.0197 suggests moderate volatility, while the ADX at 29.33 indicates a strengthening trend. The 50-day SMA is at $0.2104, and the 200-day EMA is at $0.183, showing no immediate crossover but indicating a bullish trend. Market Sentiment & Outlook: Overall sentiment is bullish, supported by the price action above the pivot point, a rising RSI, and a strengthening ADX.
Forecasting Returns: $1,000 Across Market Conditions
The table below outlines potential investment scenarios for Stellar, providing insights into expected price changes and estimated returns on a $1,000 investment.
| Scenario | Price Change | Value After 1 Month |
|---|---|---|
| Bullish Breakout | +10% to ~$0.2565 | ~$1,100 |
| Sideways Range | 0% to ~$0.2332 | ~$1,000 |
| Bearish Dip | -10% to ~$0.2099 | ~$900 |
FAQs
What are the predicted price forecasts for the asset?
The predicted daily closing price for Stellar is approximately $0.2365, with a weekly forecast of around $0.2400. The price is expected to fluctuate between $0.2320 and $0.2400 today, and $0.2350 to $0.2450 over the week.
What are the key support and resistance levels for the asset?
Key support levels for Stellar are at $0.22, $0.21, and $0.20, while resistance levels are at $0.25, $0.26, and $0.27. The pivot point is at $0.24, indicating a bullish sentiment as the price is currently above this level.
What are the main factors influencing the asset’s price?
Factors influencing Stellar’s price include increased adoption of blockchain technology, positive investor sentiment, and upcoming economic data releases. Regulatory scrutiny and market volatility also play significant roles in shaping its value.
What is the outlook for the asset in the next 1 to 6 months?
The outlook for Stellar in the next 1 to 6 months is positive, with expectations of continued growth driven by technological advancements and market adoption. Price movements are likely to range between $0.25 and $0.30 during this period.
What are the risks and challenges facing the asset?
Stellar faces risks such as regulatory scrutiny, market volatility, and competition from other cryptocurrencies. These challenges could impact its growth and price stability in the future.
Disclaimer
In conclusion, while the analysis provides a structured outlook on the asset’s potential price movements, it is essential to remember that financial markets are inherently unpredictable. Conducting thorough research and staying informed about market trends and economic indicators is crucial for making informed investment decisions.