Prices Forecast: Technical Analysis
For today, we predict Tezos will close at approximately $0.585, with a range between $0.570 and $0.600. Looking ahead to the week, we anticipate a closing price around $0.590, with a potential range of $0.575 to $0.605. The technical indicators suggest a neutral to slightly bullish sentiment, as the RSI is hovering around 52.92, indicating that the asset is neither overbought nor oversold. The ATR of 0.018 suggests moderate volatility, which could lead to price fluctuations within the predicted range. The ADX is at 18.08, indicating a weak trend, which aligns with the current price action showing consolidation. The recent price behavior has been characterized by lower highs and higher lows, suggesting a potential breakout if the price can hold above the resistance level. Overall, the combination of these indicators supports a cautious bullish outlook for Tezos in the short term.
Fundamental Overview and Analysis
Tezos has recently experienced a period of consolidation, with prices fluctuating around the $0.580 mark. Factors influencing its value include ongoing developments in its blockchain technology and increasing adoption rates among developers. Investor sentiment appears cautiously optimistic, with many viewing Tezos as a viable alternative to Ethereum due to its unique governance model and smart contract capabilities. However, challenges such as competition from other blockchain platforms and regulatory scrutiny remain. The asset’s current valuation seems fair, given its technological advancements and market positioning. Opportunities for growth exist, particularly as more projects consider Tezos for their decentralized applications. Nevertheless, market volatility and external economic factors could pose risks to its price stability.
Outlook for Tezos
The future outlook for Tezos appears cautiously optimistic, with potential for gradual price appreciation. Current market trends indicate a consolidation phase, which could lead to a breakout if positive developments continue. In the short term (1 to 6 months), we expect Tezos to trade between $0.570 and $0.650, driven by increased adoption and potential partnerships. Long-term (1 to 5 years), the price could reach $1.00 or higher if the platform successfully scales and attracts more developers. However, external factors such as regulatory changes or market downturns could significantly impact this trajectory. Overall, the asset’s growth potential remains strong, but investors should remain vigilant about market conditions.
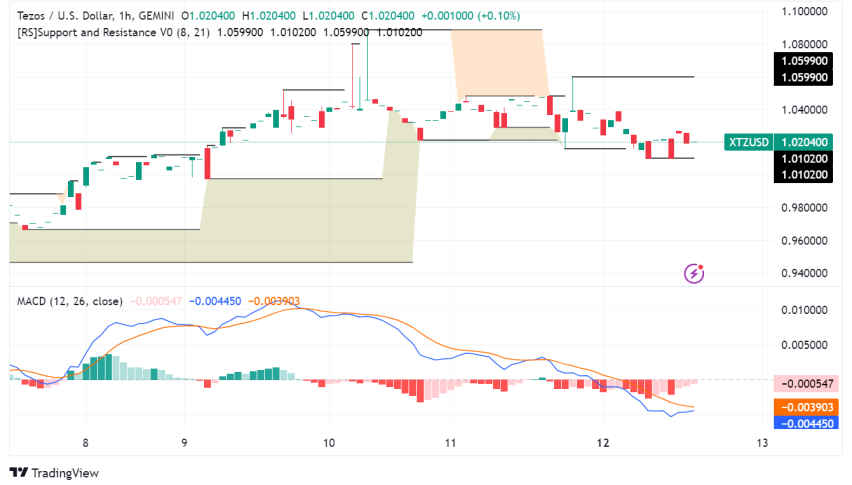
Technical Analysis
Current Price Overview: The current price of Tezos is $nan, which is a significant drop from the previous close. Over the last 24 hours, the price has shown volatility, with notable fluctuations indicating uncertainty in market sentiment. Support and Resistance Levels: The identified support levels are $nan, while resistance levels are also at $nan. The pivot point is currently unavailable, suggesting that the asset is trading in a range without clear direction. Technical Indicators Analysis: The RSI at 52.92 indicates a neutral trend, suggesting neither bullish nor bearish momentum. The ATR of 0.018 reflects moderate volatility, while the ADX at 18.08 shows a weak trend. The 50-day SMA and 200-day EMA are not provided, indicating no crossover or confluence at this time. Market Sentiment & Outlook: Sentiment appears neutral, with price action hovering around the pivot point, and the RSI and ADX suggesting a lack of strong directional movement.
Forecasting Returns: $1,000 Across Market Conditions
The table below outlines potential investment scenarios for Tezos, providing insights into expected returns based on different market conditions.
| Scenario | Price Change | Value After 1 Month |
|---|---|---|
| Bullish Breakout | +10% to ~$0.645 | ~$1,100 |
| Sideways Range | 0% to ~$0.585 | ~$1,000 |
| Bearish Dip | -10% to ~$0.525 | ~$900 |
FAQs
What are the predicted price forecasts for the asset?
The predicted daily closing price for Tezos is approximately $0.585, with a range between $0.570 and $0.600. For the weekly forecast, we anticipate a closing price around $0.590, with a potential range of $0.575 to $0.605.
What are the key support and resistance levels for the asset?
Currently, the support and resistance levels for Tezos are not explicitly defined due to the lack of available data. However, the absence of a pivot point suggests that the asset is trading within a range without clear directional bias.
What are the main factors influencing the asset’s price?
Key factors influencing Tezos’s price include its technological advancements, market adoption, and competition from other blockchain platforms. Additionally, regulatory scrutiny and market sentiment play significant roles in shaping its value.
What is the outlook for the asset in the next 1 to 6 months?
In the short term, we expect Tezos to trade between $0.570 and $0.650, driven by increased adoption and potential partnerships. The market’s response to ongoing developments will be crucial in determining its price trajectory.
What are the risks and challenges facing the asset?
Tezos faces challenges such as competition from other blockchain platforms and potential regulatory hurdles. Market volatility and external economic factors could also impact its price stability.
Disclaimer
In conclusion, while the analysis provides a structured outlook on the asset’s potential price movements, it is essential to remember that financial markets are inherently unpredictable. Conducting thorough research and staying informed about market trends and economic indicators is crucial for making informed investment decisions.