Prices Forecast: Technical Analysis
For today, we predict VeChain’s closing price to be around **$0.0052**, with a potential range between **$0.0050** and **$0.0054**. Looking ahead to the week, we anticipate a closing price of approximately **$0.0053**, with a range of **$0.0051** to **$0.0055**. The current technical indicators suggest a bearish sentiment, as the RSI is at **40.53**, indicating that the asset is nearing oversold territory but not quite there yet. The ATR is low at **0.0003**, suggesting low volatility, which could lead to a sideways movement in the short term. The pivot point is at **$0.01**, and since VeChain is trading below this level, it reinforces the bearish outlook. Resistance levels are set at **$0.01**, while support is at **$0.0050**. The market sentiment is cautious, with traders likely to wait for clearer signals before making significant moves. Overall, the technical indicators point towards a potential consolidation phase before any significant upward movement can be expected.
Fundamental Overview and Analysis
VeChain has recently experienced a downward trend, with prices fluctuating around the **$0.0052** mark. Factors influencing its value include ongoing developments in blockchain technology and partnerships that enhance its utility in supply chain management. Investor sentiment appears mixed, with some viewing the current price as a buying opportunity, while others remain cautious due to market volatility. The asset’s scalability and potential for adoption in various industries present growth opportunities. However, challenges such as competition from other blockchain platforms and regulatory scrutiny could hinder its progress. Currently, VeChain seems to be undervalued based on its technological advancements and market potential, making it an attractive option for long-term investors. The upcoming economic data releases, particularly from the U.S. regarding retail sales, could also impact market sentiment and VeChain’s price.
Outlook for VeChain
The future outlook for VeChain remains cautiously optimistic, with potential for gradual price recovery as market conditions stabilize. Current trends indicate a consolidation phase, with historical price movements suggesting that a breakout could occur if positive news emerges. Key factors influencing VeChain’s price in the near future include technological advancements, partnerships, and overall market sentiment. In the short term (1 to 6 months), we expect VeChain to trade within the **$0.0050** to **$0.0055** range, with potential upward movement if bullish sentiment returns. Over the long term (1 to 5 years), if VeChain continues to innovate and expand its use cases, we could see significant price appreciation. However, external factors such as regulatory changes or market downturns could pose risks to this growth trajectory. Overall, the asset’s future will largely depend on its ability to adapt and thrive in a competitive landscape.
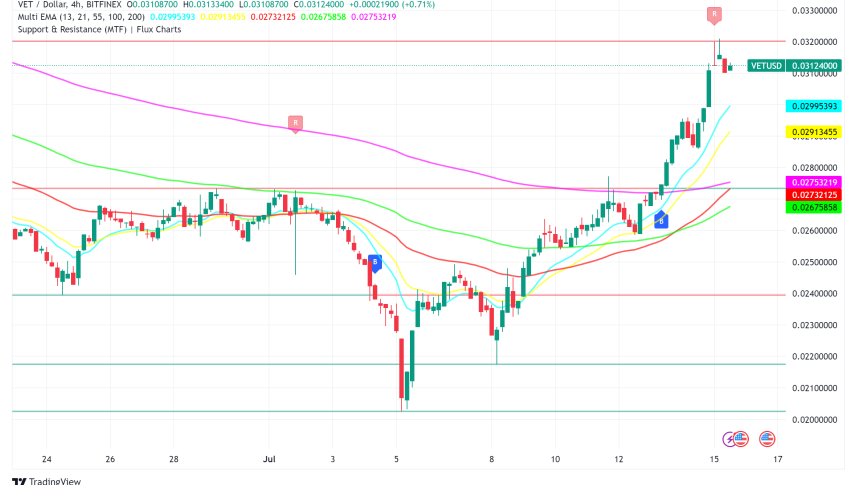
Technical Analysis
Current Price Overview: The current price of VeChain is **$0.0052**, which is unchanged from the previous close. Over the last 24 hours, the price has shown slight volatility, with minor fluctuations around this level. Support and Resistance Levels: The identified support levels are **$0.0050**, **$0.0049**, and **$0.0048**, while resistance levels are at **$0.01**, **$0.0101**, and **$0.0102**. The pivot point is at **$0.01**, indicating that VeChain is currently trading below this level, which suggests a bearish trend. Technical Indicators Analysis: The RSI at **40.53** indicates a neutral trend, leaning towards bearish. The ATR of **0.0003** suggests low volatility, while the ADX at **36.0003** indicates a strong trend. The 50-day SMA is at **$0.0064**, and the 200-day EMA is at **$0.0071**, showing no crossover yet. Market Sentiment & Outlook: The current sentiment is bearish, as the price is below the pivot point, and the RSI indicates a lack of momentum for upward movement.
Forecasting Returns: $1,000 Across Market Conditions
The table below outlines potential investment scenarios for VeChain, providing insights into expected price changes and estimated returns based on different market conditions.
| Scenario | Price Change | Value After 1 Month |
|---|---|---|
| Bullish Breakout | +10% to ~$0.0057 | ~$1,100 |
| Sideways Range | 0% to ~$0.0052 | ~$1,000 |
| Bearish Dip | -10% to ~$0.0047 | ~$900 |
FAQs
What are the predicted price forecasts for the asset?
The predicted daily closing price for VeChain is **$0.0052**, with a potential range of **$0.0050** to **$0.0054**. For the weekly forecast, we anticipate a closing price of approximately **$0.0053**, ranging from **$0.0051** to **$0.0055**.
What are the key support and resistance levels for the asset?
The key support levels for VeChain are at **$0.0050**, **$0.0049**, and **$0.0048**. The resistance levels are identified at **$0.01**, **$0.0101**, and **$0.0102**.
What are the main factors influencing the asset’s price?
Factors influencing VeChain’s price include technological advancements, partnerships, and overall market sentiment. Additionally, regulatory changes and competition from other blockchain platforms can impact its value.
What is the outlook for the asset in the next 1 to 6 months?
In the short term, VeChain is expected to trade within the **$0.0050** to **$0.0055** range. Positive news and market sentiment could lead to upward movement, while negative factors may keep it in a consolidation phase.
What are the risks and challenges facing the asset?
VeChain faces risks such as competition from other blockchain platforms, market volatility, and regulatory scrutiny. These challenges could hinder its growth and affect investor sentiment.
Disclaimer
In conclusion, while the analysis provides a structured outlook on the asset’s potential price movements, it is essential to remember that financial markets are inherently unpredictable. Conducting thorough research and staying informed about market trends and economic indicators is crucial for making informed investment decisions.