Oversold Gold – Investors Ready To Catch Retracement
Yesterday, the gold fell drastically, dropping more than 200 points. The fall was due to the stronger US dollar. Most of the pressure was caused by a sharp uptick in US bond returns after the release of positive manufacturing activity figures. This activity signals robust economic growth in the United States.
As we mentioned in our weekly forex signal report, the buck was supposed to trade with a bullish sentiment. This is to be expected as investors are likely to price in the optimistic expectations of the US NFP and Unemployment rates before their release on Friday.
Forex Trading Signal – Idea
Today we have two options for trading the gold:
– Buy above $1220 with the take profit of $1227 and stop loss below $1217.
– Sell below $1229 with a take profit of $1221 and stop loss above $1232.
 Gold 4-Hour Chart – Retracement In Play
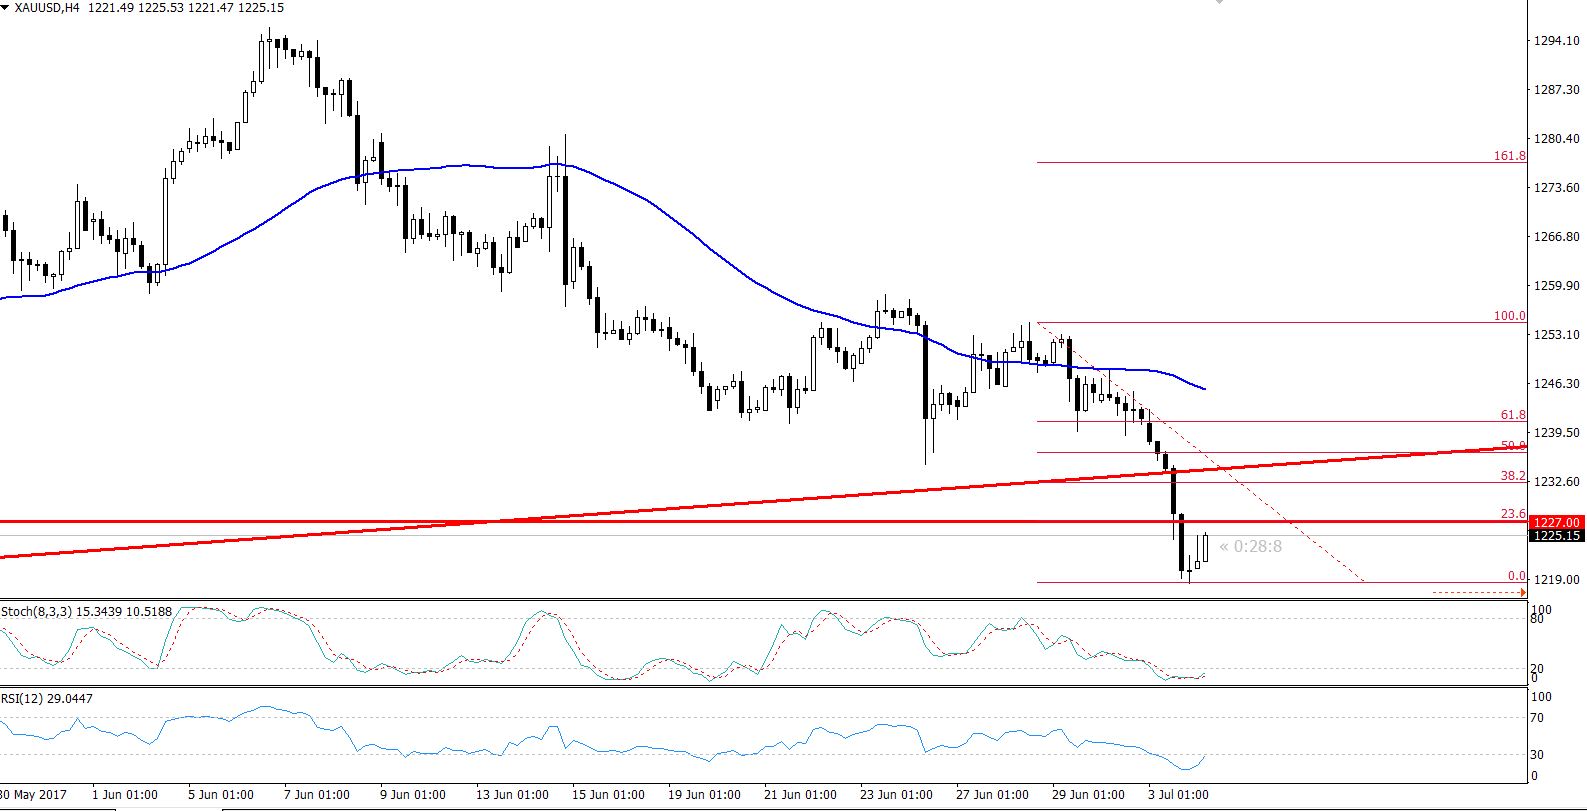
Key Technical Points
On the 4-hour chart, both of our leading indicators, the RSI and Stochastic, have entered the oversold region. This means that the gold could bounce back to complete the 23.6% Fibonacci at $1227 and 38.2% Fibonacci at $1232.
However, the moving averages are signaling a selling trend in gold. To be safe, let's wait for the market to complete the retracement before entering a sell position in gold.
- Check out our free forex signals
- Follow the top economic events on FX Leaders economic calendar
- Trade better, discover more Forex Trading Strategies
- Open a FREE Trading Account
- Read our latest reviews on: Avatrade, Exness, HFM and XM
Related Articles


Sidebar rates
Related Posts
