H1 or H4 Chart for EUR/USD
The EUR/USD has been climbing up this week and in the last several hours we see a reverse lower. This looks like a good opportunity to buy..
The EUR/USD has been climbing up this week and in the last several hours we see a reverse lower. This looks like a good opportunity to buy a forex signal, although still deciding whether to use the H1 or H4 chart for our trade.
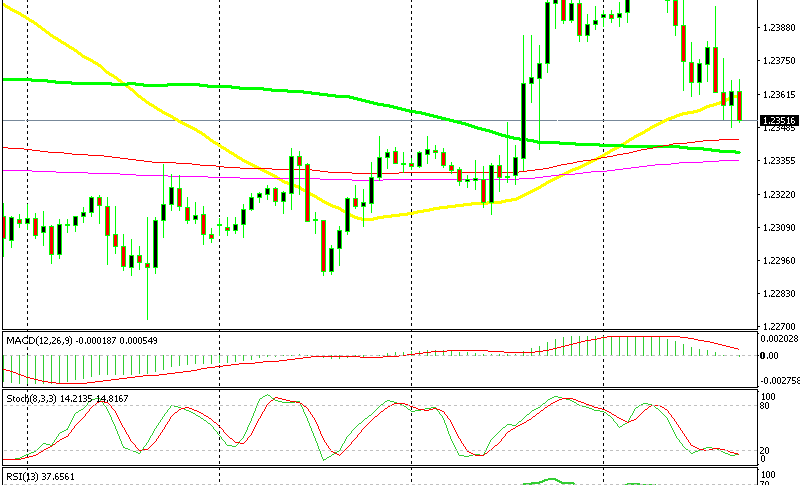
On the hourly chart, the retrace lower is complete and the stochastic indicator has been oversold for a few hours. The moving averages are providing some form of support for this pair, the retrace can be over. In this case, we should go long and not miss the chance.
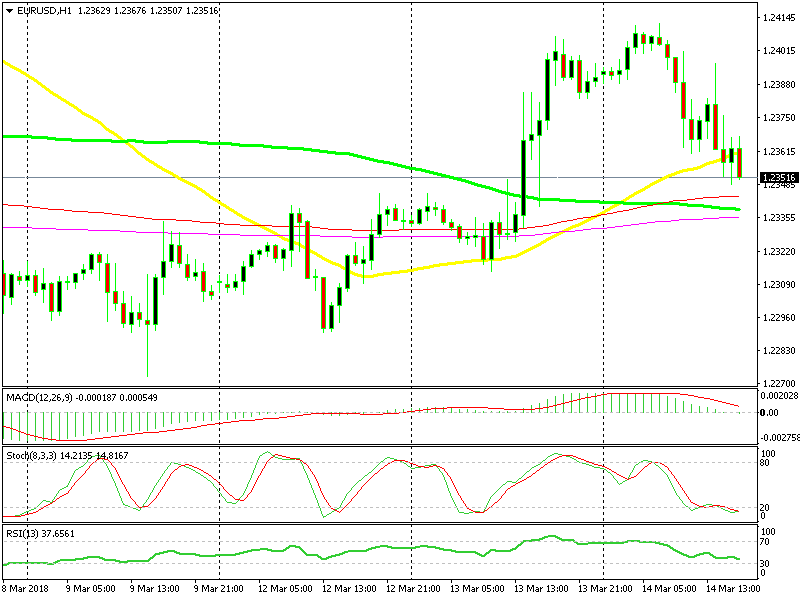
The retrace is complete on this chart
The picture on the H4 chart tells a different story. The 50 SMA (yellow) is providing support at the moment and the stochastic indicator is not oversold just yet, indicating the retrace is not complete.
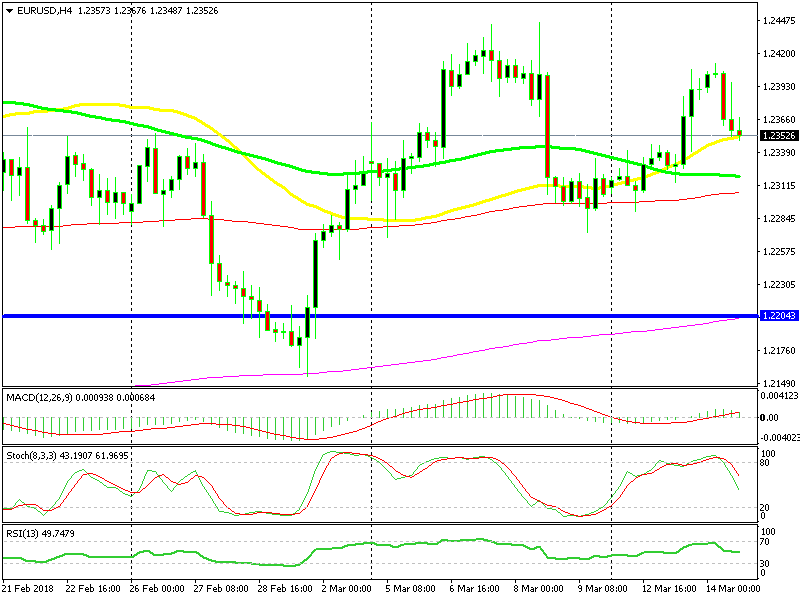
The 50 SMA is stopping the decline right now
If the retrace is to unfold in full on this timeframe chart, then stochastic should become oversold. For it to become so, this forex pair should move to the 100 SMA (red). That moving average has provided support in the last two weeks and will likely work as support again. It stands at 1.23, plenty of room to run on the downside.
Forex traders are looking at the H1 chart and the reverse can begin immediately or unfold until the EUR/USD falls to 1.23. Forex dilemmas, fellas! We will wait to see the price action before making a decision.
- Check out our free forex signals
- Follow the top economic events on FX Leaders economic calendar
- Trade better, discover more Forex Trading Strategies
- Open a FREE Trading Account
- Read our latest reviews on: Avatrade, Exness, HFM and XM
Related Articles

Sidebar rates
Related Posts
