EUR/USD Forming A Bearish Reversal Pattern in the Weekly Chart
EUR/USD has been trading on a bearish trend in the last several months but it reversed in the last several weeks. Now, the chart setup is...
EUR/USD has been trading on a bearish trend in the last several months losing around 12 cents from top to bottom. But in the last several weeks, EUR/USD has reversed back up, climbing around four cents in the process.
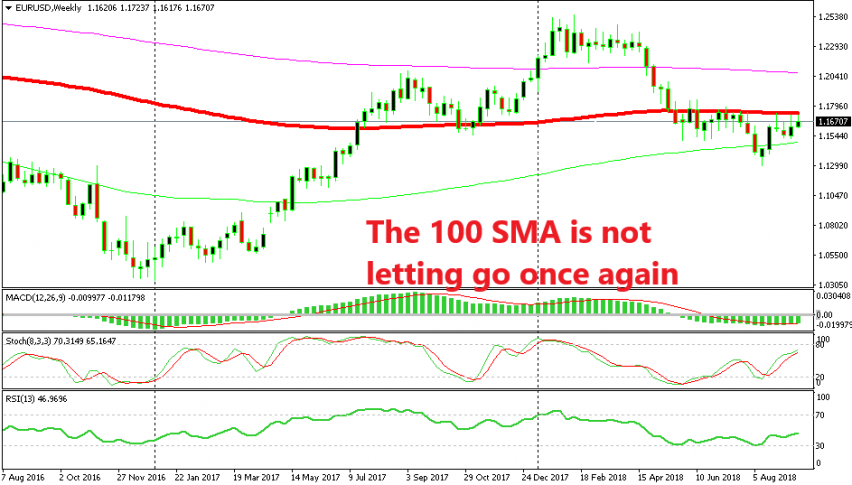
Although, at the moment, it seems like this pair might have reached the peak for now. As we can see from the weekly chart above, EUR/USD has moved higher in August but it reached the 100 SMA (red) on this time-frame and it hasn’t been able to push above it.
The 100 SMA has provided solid resistance in the last few weeks now and it did the same in the first two months of summer. If we scroll back, we see that the 100 SMA used to be a support indicator last year, but once it got broken it turned into resistance.
EUR/USD lost around 400 pips after the buyers failed to break back above it in July, even though the stochastic indicator was not overbought. Now, stochastic is almost overbought and next week it will definitely be overbought if we don’t see a quick reversal this week.
This sort of chart setup points to a bearish reversal soon and we are thinking about opening a long term sell forex trade here. The ECB doesn’t seem to be turning hawkish anytime soon, so perhaps we should sell EUR/USD right now. The only person which might ruin this trade is Donald Trump but I think we should go with the technical analysis at the moment.
- Check out our free forex signals
- Follow the top economic events on FX Leaders economic calendar
- Trade better, discover more Forex Trading Strategies
- Open a FREE Trading Account
- Read our latest reviews on: Avatrade, Exness, HFM and XM
Related Articles


Sidebar rates
Related Posts
