Shorting the Retrace in EUR/USD at the 100 SMA
EUR/USD has retraced higher today, but the 100 SMA is stopping the climb on the H1 chart, where we decided to sell this pair
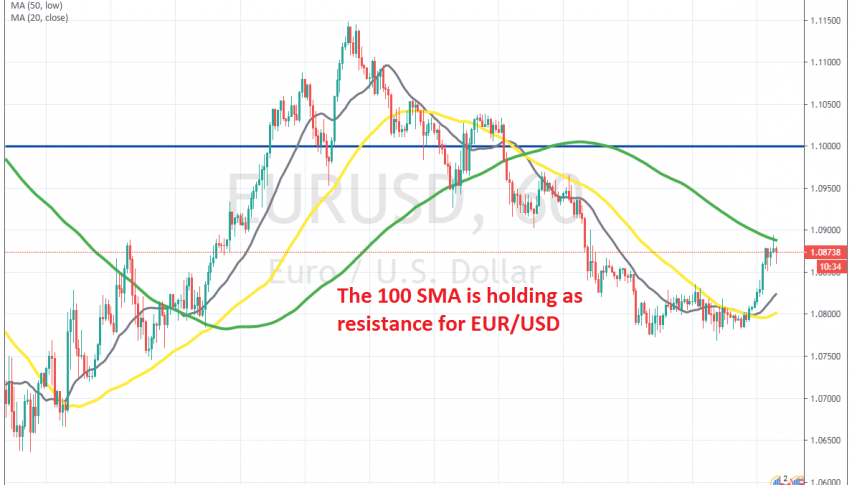
[[EUR/USD]] has had such an interesting period in the last several weeks. It surged higher at the end of February, reaching 1.15. But the price reversed down in the second week of March, taking the price nearly 9 cents lower, making new lows.
Although, in the last week of March, we saw another reversal higher, as the demand for the USD as a global reserve currency declined. EUR/USD rallied around 5 cents higher. But, the sellers returned again last week and the price fell to 1.07070s.
Today though, we saw a bullish retrace higher during the Asian session, which continued during the European session as well. But, it seems like the 100 SMA (green) is providing resistance on the H1 chart. It rejected EUR/USD in the first attempt and an upside-down hammers candlestick formed below it, which is a reversing signal. We decided to sell below that moving average, hoping that the pullback will be complete and the bearish trend will resume.
- Check out our free forex signals
- Follow the top economic events on FX Leaders economic calendar
- Trade better, discover more Forex Trading Strategies
- Open a FREE Trading Account
- Read our latest reviews on: Avatrade, Exness, HFM and XM
Related Articles


Sidebar rates
Related Posts
