NZD/USD Seems Stuck Between 2 MAs on the Daily Chart
NZD/USD has retreated higher after the big decline in March, but now it is trading between 2 MAs
[[NZD/USD]] has been on a long term bearish trend, starting about two years ago. Although, we saw a decent pullback in Q4 of last year, as the sentiment improved, as China and the US calmed their tones regarding the trade war that had been going on for more than a year.
As a result, risk assets turned higher in Q4, but once the new year started, the sentiment turned negative again and the decline resumed. NZD/USD lost around 13 cents from the beginning of January, with the decline picking up pace in the first half od March, as coronavirus broke out in Europe and the panic hit financial markets.
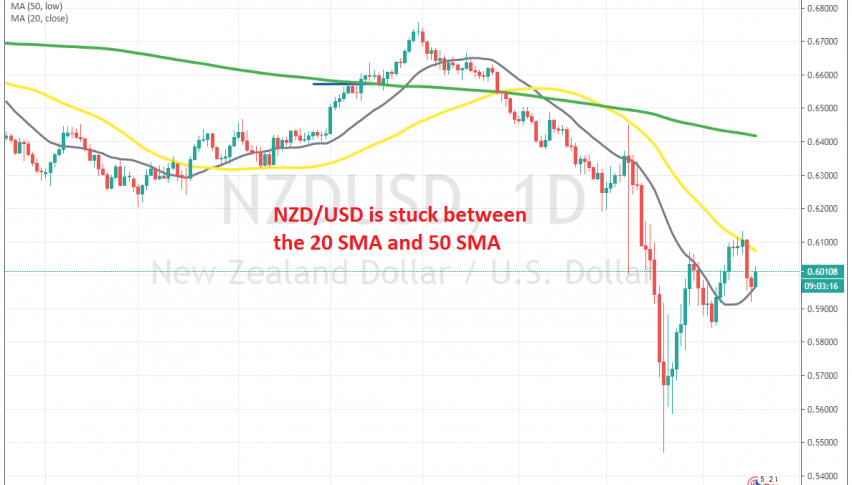
But the decline stopped by the middle of March as the run for safe haven into the USD as a global reserve currency. The 20 SMA (grey) turned into resistance for some time on the H1 chart, which pushed the price around 200 pips lower. But, it was eventually broken and the price moved higher, although the 50 SMA turned into resistance this time.
It rejected the price and NZD/USD fell 20 pips lower, but the 20 SMA turned into support now. It held the decline, despite a brief piercing and NZD/USD is bouncing off this moving average now. So, this pair seems to be stuck between these two moving averages now, so whichever side it break out, will be the winner.
- Check out our free forex signals
- Follow the top economic events on FX Leaders economic calendar
- Trade better, discover more Forex Trading Strategies
- Open a FREE Trading Account
- Read our latest reviews on: Avatrade, Exness, HFM and XM
Related Articles


Sidebar rates
Related Posts
