Gold Forms A Bullish Reversing Pattern Above the 50 Daily SMA
Gold retraced lower during the last two weeks, but the 50 SMA held as support once again
GOLD has been bullish for about two years, but in summer last year the uptrend picked up pace, as the trade war between US and China escalated and the global economy weakened. In Q4 of last year we saw a slight retrace down, before the mud hit the fan this year due to the coronavirus pandemic.
As a result, the trend picked up pace again once the new year started and Gold has been pretty bullish since then. We did see a decent pullback by the middle of March, as markets turned into the USD as a global reserve currency. But the pullback ended at the support at $1,500.
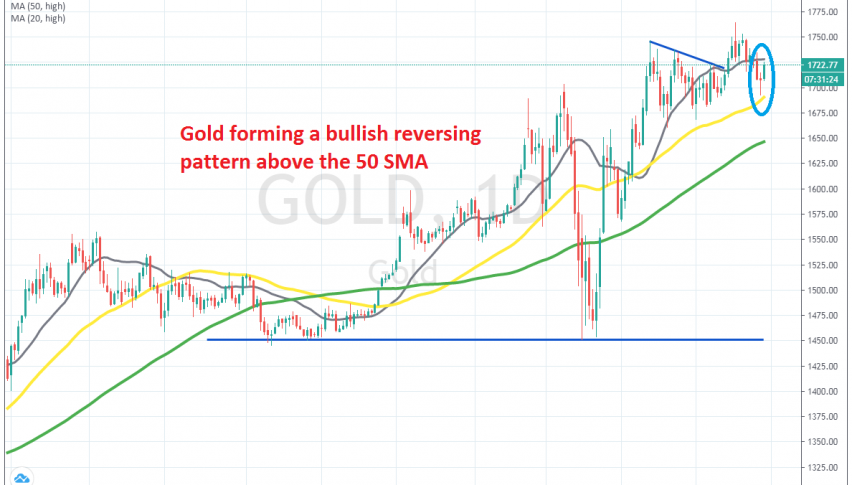
Last week, Gold reached $1,750 but then started to retrace back down. Although, the retrace seems to have ended just above the 50 SMA (yellow) which has been providing support and resistance for Gold quite a few times before, as the daily chart shows. Gold formed a doji candlestick yesterday above the 50 SMA, which is a bullish reversing signal. Today’s candlestick looks pretty bullish, so buyers are back in charge, but we’ll see if they will be able to push above the 20 SMA (grey) which stands right above.
- Check out our free forex signals
- Follow the top economic events on FX Leaders economic calendar
- Trade better, discover more Forex Trading Strategies
- Open a FREE Trading Account
- Read our latest reviews on: Avatrade, Exness, HFM and XM
Related Articles


Sidebar rates
Related Posts
