Getting Ready to Sell EUR/GBP at the 100 SMA
EUR/GBP is trading in a triangle and now it is headed for the top at the 100 SMA
EUR/GBP surged during late February and the first half of March more than 12 cents higher. We sqw a pullback lower until the first week of May, but the bullish trend resumed again and still remains on for this pair on the daily chart, but since late September we are in a retrace mode.
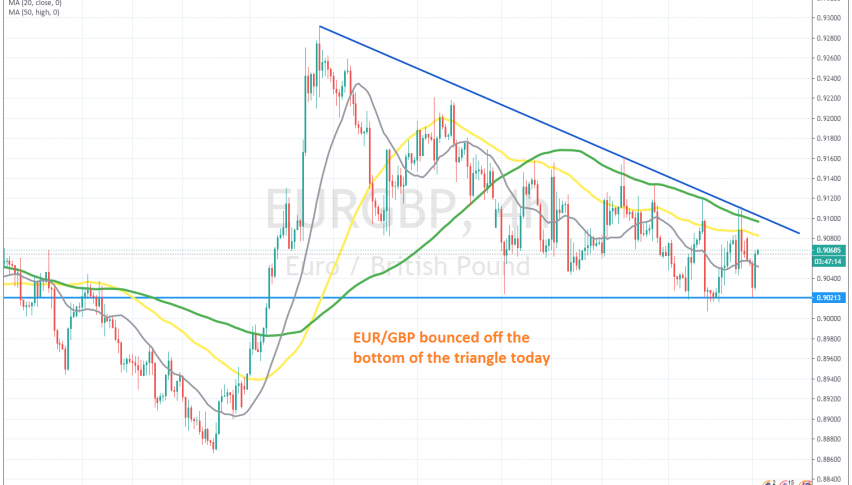
During the first half of September, we saw a surge in EUR/GBP, taking this pair around 450 pips higher, but since then, the price has been retracing lower. The price has formed a triangle during this time, with a support zone around 0.9020 and the 100 MSA (green) working as resistance on the H4 chart.
The 100 SMA is moving down, pushing the highs lower, while the support zone is still holding. Earlier today we saw this pair bounce off this level and now it is heading for the top of the triangle. We will wait to see how the price reacts up there, and if the 100 SMA rejects EUR/GBP again, we will open a sell forex signal.
- Check out our free forex signals
- Follow the top economic events on FX Leaders economic calendar
- Trade better, discover more Forex Trading Strategies
- Open a FREE Trading Account
- Read our latest reviews on: Avatrade, Exness, HFM and XM