Decisive Time for Oil at the 50 Daily SMA, After Falling Below $60
Crude Oil is finding support at the 50 daily SMA, after crashing $ 6 lower yesterday
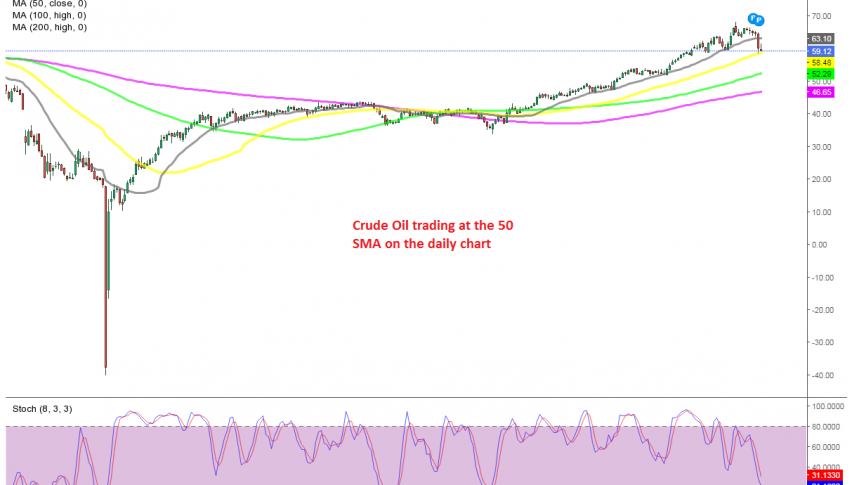
Crude Oil has been really bullish since April last year, when it reversed from the abyss, following a crash to -$ 37 for US WTI crude. Buyers have been pushing higher without much resistance on the way, apart from the slight pullback in September and October.
But, that pullback didn’t last and Oil resumed the bullish trend, pushing above $50 and $ 60 pretty easily. During the bullish trend, moving averages have been doing a great job as support for Oil, especially the 20 SMA (gray) on the daily chart.
Although yesterday we saw a big reversal and a crash lower, which took the price more than 6 cents down. The 20 SMA was broken on the daily chart and after a failed attempt to reverse the price higher, Oil is back down, trading at the 50 SMA (yellow) now. This might be a good place to look for longs on Oil, but yesterday’s decline was too strong, so we are observing the price action down here, in order to decide whether to buy Oil or not.
- Check out our free forex signals
- Follow the top economic events on FX Leaders economic calendar
- Trade better, discover more Forex Trading Strategies
- Open a FREE Trading Account
- Read our latest reviews on: Avatrade, Exness, HFM and XM
Related Articles


Sidebar rates
Related Posts
