Missed the Opportunity to Buy US Oil on Friday
Crude Oil continues to find support at moving averages as the trend remains bullish
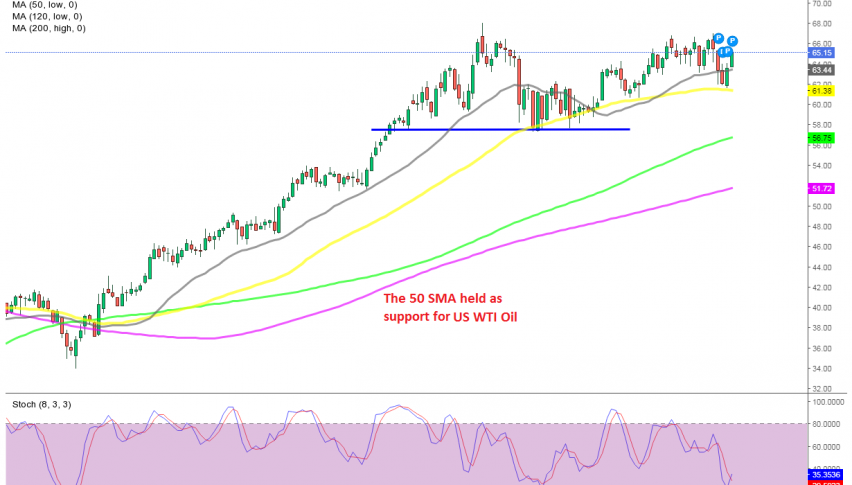
Crude Oil has been quite bullish since the big reversal in April last year, when US WTI crude went crashing down to $-37. We have seen two pullbacks lower, once in Autumn last year and once in March this year, but they were quite weak suggesting that the bullish trend would continue, which it did.
The latest pullback took place last week, with the US WTI crude retreating from around $67 to $61.50s. That’s where the 50 SMA (yellow) was standing on the daily chart, which provided solid support this time.
Crude Oil bounced off that moving average which was signalled by the stochastic indicator as well, since it reached the oversold area. Now Oil is trading nearly $4 higher, so we lost the opportunity to golong at the 50 SMA on Friday. Well, the pressure remains to the upside in Oil, so we will try to buy on another pullback lower.
- Check out our free forex signals
- Follow the top economic events on FX Leaders economic calendar
- Trade better, discover more Forex Trading Strategies
- Open a FREE Trading Account
- Read our latest reviews on: Avatrade, Exness, HFM and XM
Related Articles


Sidebar rates
Related Posts
