Bitcoin Price Prediction – Break Above $42K Could Drive Sharp Uptrend
Bitcoin's recovery against the US dollar has pushed it above $41,400. If there is a clear close above $41,500 and $41,800, BTC could rally
Bitcoin’s recovery against the US dollar has pushed it above $41,400. If there is a clear close above $41,500 and $41,800, BTC could rally even further. BITCOIN has begun a decent recovery wave above $41,000 and $41,400. Currently, the price is trading above $41,000 and above the 100-hourly simple moving average.
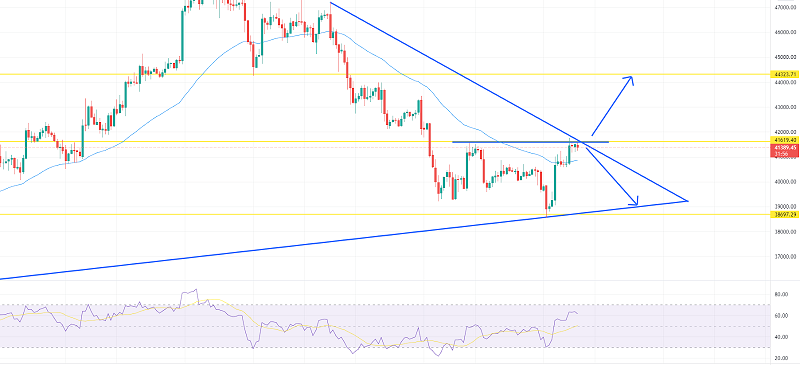
On the hourly timeframe of the BTC/USD pair, a short-term contracting triangle is forming with resistance near $41,510. To begin a major upward move, the pair must break through the $41,500 and $41,800 resistance levels.
Bitcoin’s Price is Increasing
Bitcoin’s price has formed a base above $40,000 per coin. BTC began a solid recovery wave and was able to break through the $41,000 resistance zone. The price remained in the positive zone, rising above the $41,400 mark. It even broke through the $41,500 barrier and settled above the 100 hourly simple moving average. The price has formed a high near $41,825 and is now consolidating gains.
Bitcoin is trading well above the 23.6 percent Fib retracement level of the recent wave from the swing low of $38,570 to the high of $41,825. On the hourly chart of the BTC/USD pair, a short-term contracting triangle is forming with resistance near $41,510.
On the upside, immediate resistance is near the $41,500 level. The next significant resistance level could be $41,800. To begin a strong upward move, the price must first settle above $41,500 and then clear $41,800. If the bulls are successful, the price could rise to the $42,500 resistance level. Any further gains may necessitate a move towards the $43,200 level.
Dips in BTC are Limited?
If BTC/USD fails to break through the $41,500 resistance level, it may begin a downward trend. On the lower side, there is immediate support near the $41,050 level.
The next major support is found near the $40,400 level and the 100 hourly simple moving average. It is close to the 50% Fib retracement level of the recent wave from the swing low of $38,570 to the high of $41,825. A break below the $40,400 and $40,000 support levels could increase selling pressure.
- Check out our free forex signals
- Follow the top economic events on FX Leaders economic calendar
- Trade better, discover more Forex Trading Strategies
- Open a FREE Trading Account
- Read our latest reviews on: Avatrade, Exness, HFM and XM
Related Articles

Sidebar rates
Related Posts
