Ethereum price analysis today: will ETH/USD break above $2K?
Ethereum price analysis today: Introduction
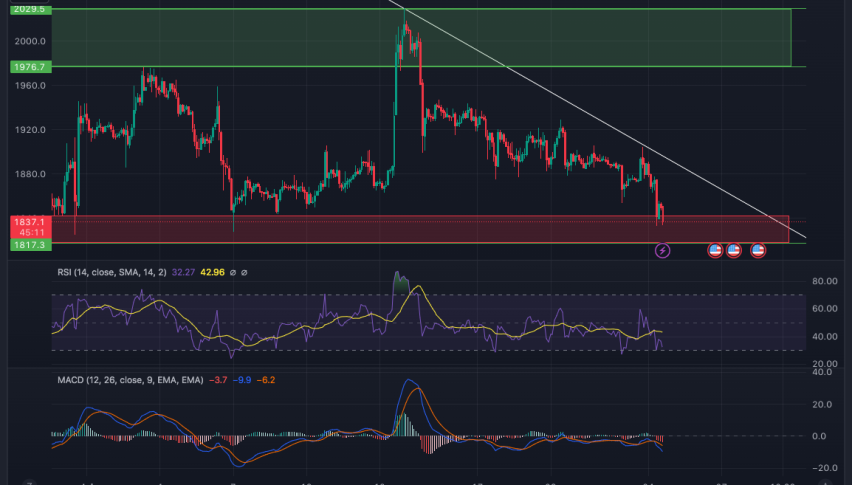
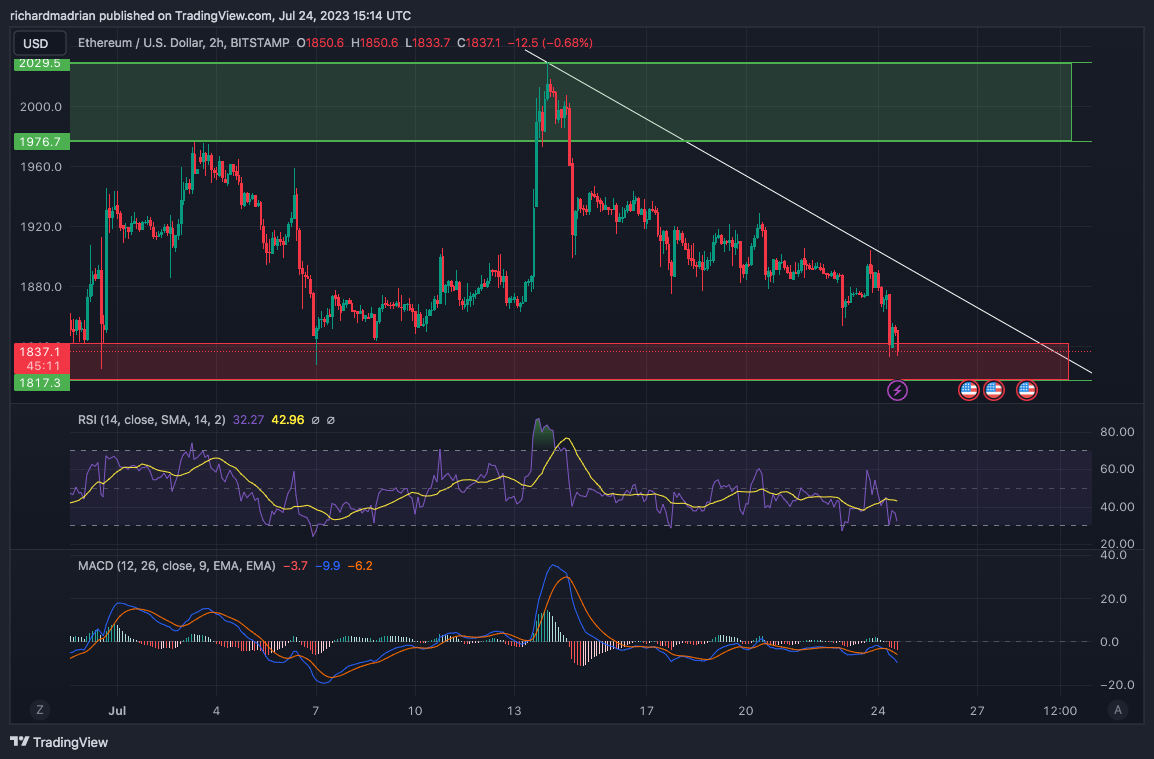
According to our Ethereum price analysis today, ETH/USD pair has been experiencing a decline in price since testing the monthly high of $2029 on July 14, 2023. The current price for ETH/USD is $1843, and it is important to note that the demand zone lies between $1976 and $2029. This zone could serve as a critical area of support and resistance, where significant price action may occur.
The 20-day Exponential Moving Average (EMA) is currently at $1896, indicating a short-term trend direction. With the current price trading below the 20-day EMA, it suggests a bearish sentiment in the short term.
Furthermore, the 50-day Simple Moving Average (SMA) at $1854 is another crucial support level for ETH/USD. A successful rally above this level could potentially pave the way for a significant price increase above $19,000.
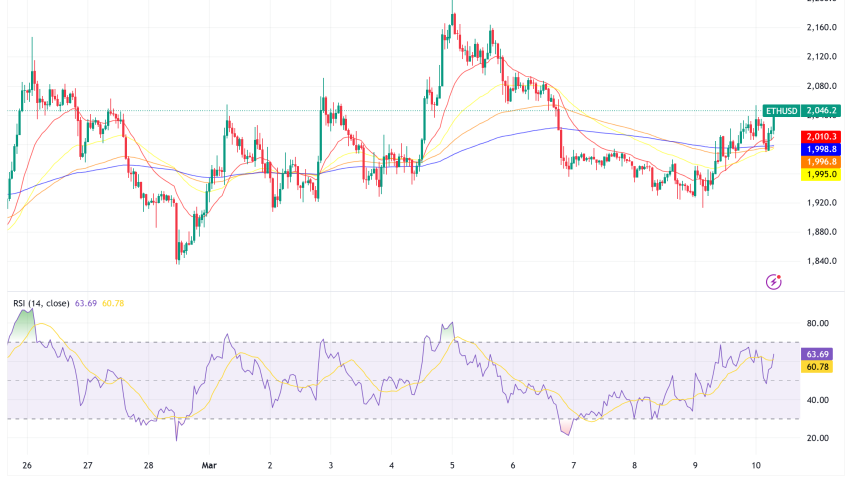
Ethereum price analysis today: RSI and MACD
On the other hand, the Relative Strength Index (RSI) is at 43, which is considered neutral. This means that there is no significant overbought or oversold condition at the moment. However, the RSI being below 50 indicates a slight bearish bias in the market sentiment.
The MACD level of -1.6 indicates a sell signal, which aligns with the current downward price trend. Moreover, the Momentum indicator at -97.5 signals a strong selling pressure in the market, reinforcing the bearish sentiment.
Taking all these technical indicators into account, it is likely that ETH/USD could break down to the support levels of $1800 and $1700. Such a move would suggest that the bears have taken control of the market, and the possibility of testing the downside 200-day Exponential Moving Average at $1776 becomes a possibility.
In this scenario, the price of ETH/USD could enter into a period of oscillations within the range of $1600 to $2000, as traders and investors seek equilibrium in the market.
However, there is still a potential bullish scenario. If the pair manages to break above the 50-period SMA, there could be a chance of testing a new major support level above $2000. This would indicate a resurgence of bullish momentum and might lead to a more substantial price increase.
Ethereum price analysis today: Indicators and oscillators
Looking at the overall sentiment of various indicators, there seems to be a bearish bias. Out of the 26 total indicators analyzed, 13 are suggesting a sell signal, while only 4 are indicating a buy signal. The remaining 9 are neutral, reflecting the current uncertainty in the market.
In terms of oscillators, there are 2 sell signals, 8 neutral signals, and just 1 buy signal, further supporting the bearish outlook.
Among the moving averages, 11 are signalling a sell, 1 is neutral, and only 1 is indicating a buy signal. This reinforces the bearish sentiment in the market.
ETH/USD price analysis today: Conclusion
In conclusion, the technical analysis of ETH/USD indicates a bearish bias in the short to medium term. The price has been on a decline since testing the monthly high, and various indicators point to a potential further downside to the levels of $1800 and $1700. However, a break above the 50-period SMA could signal a possible resurgence of bullish momentum and lead to a test of higher price levels above $2000. Traders and investors should closely monitor these critical support and resistance levels to make informed decisions in the volatile market environment.
- Check out our free forex signals
- Follow the top economic events on FX Leaders economic calendar
- Trade better, discover more Forex Trading Strategies
- Open a FREE Trading Account
- Read our latest reviews on: Avatrade, Exness, HFM and XM
Related Articles
Sidebar rates
Related Posts
