Gold Price Forecast: XAU/USD Eyes $2,650 as US CPI Data Looms
Gold (XAU/USD) extended its losing streak for the sixth consecutive day, dropping 0.37% to trade around $2,610 following the release

Gold (XAU/USD) extended its losing streak for the sixth consecutive day, dropping 0.37% to trade around $2,610 following the release of the Federal Reserve’s September Meeting Minutes.

The Minutes revealed that a “substantial majority” of the Federal Open Market Committee (FOMC) favored a 50-basis-point (bps) rate cut, while some members preferred a more conservative 25 bps reduction. This uncertainty has led to increased market volatility and ongoing pressure on gold prices.
The CME FedWatch Tool indicates that the likelihood of a 25 bps rate cut in November dropped to 75.9% from 85.2% a day earlier, signaling shifting market sentiment. Additionally, US Treasury yields continued to climb, with the 10-year Treasury note reaching 4.06%, up 5.5 bps. This, coupled with a stronger US Dollar Index (DXY) at 102.90, its highest level since mid-August, weighed heavily on gold prices.
Morning Cues
– S&P and Dow end at record highs
– CPI data awaited in the US tonight
– Asian markets higher, GIFT nifty indicating open in the green of around 125 pts
– DIIs Buy 3509cr, FIIs Sell 4,563cr in Cash
– TCS reports numbers today
– Crude and gold prices continue to fall— Sonal Bhutra (@sonalbhutra) October 10, 2024
US CPI Report in Focus as Traders Eye Inflation Data
All eyes are now on the upcoming US Consumer Price Index (CPI) report, which is forecasted to show a decline from 2.5% to 2.3% year-over-year (YoY). Monthly CPI is expected to come in at 0.1%, down from 0.2%. If the data aligns with expectations, it could signal a continuation of the Fed’s dovish stance, potentially providing some relief for gold.
Core CPI is anticipated to remain unchanged at 3.2% YoY. Any deviation from these estimates could either strengthen or weaken the case for future rate cuts, impacting gold prices significantly. Additionally, Initial Jobless Claims data for the week ending October 5 is projected to show 230K new claims, slightly higher than the previous reading of 225K.
Technical Analysis: Key Levels to Watch
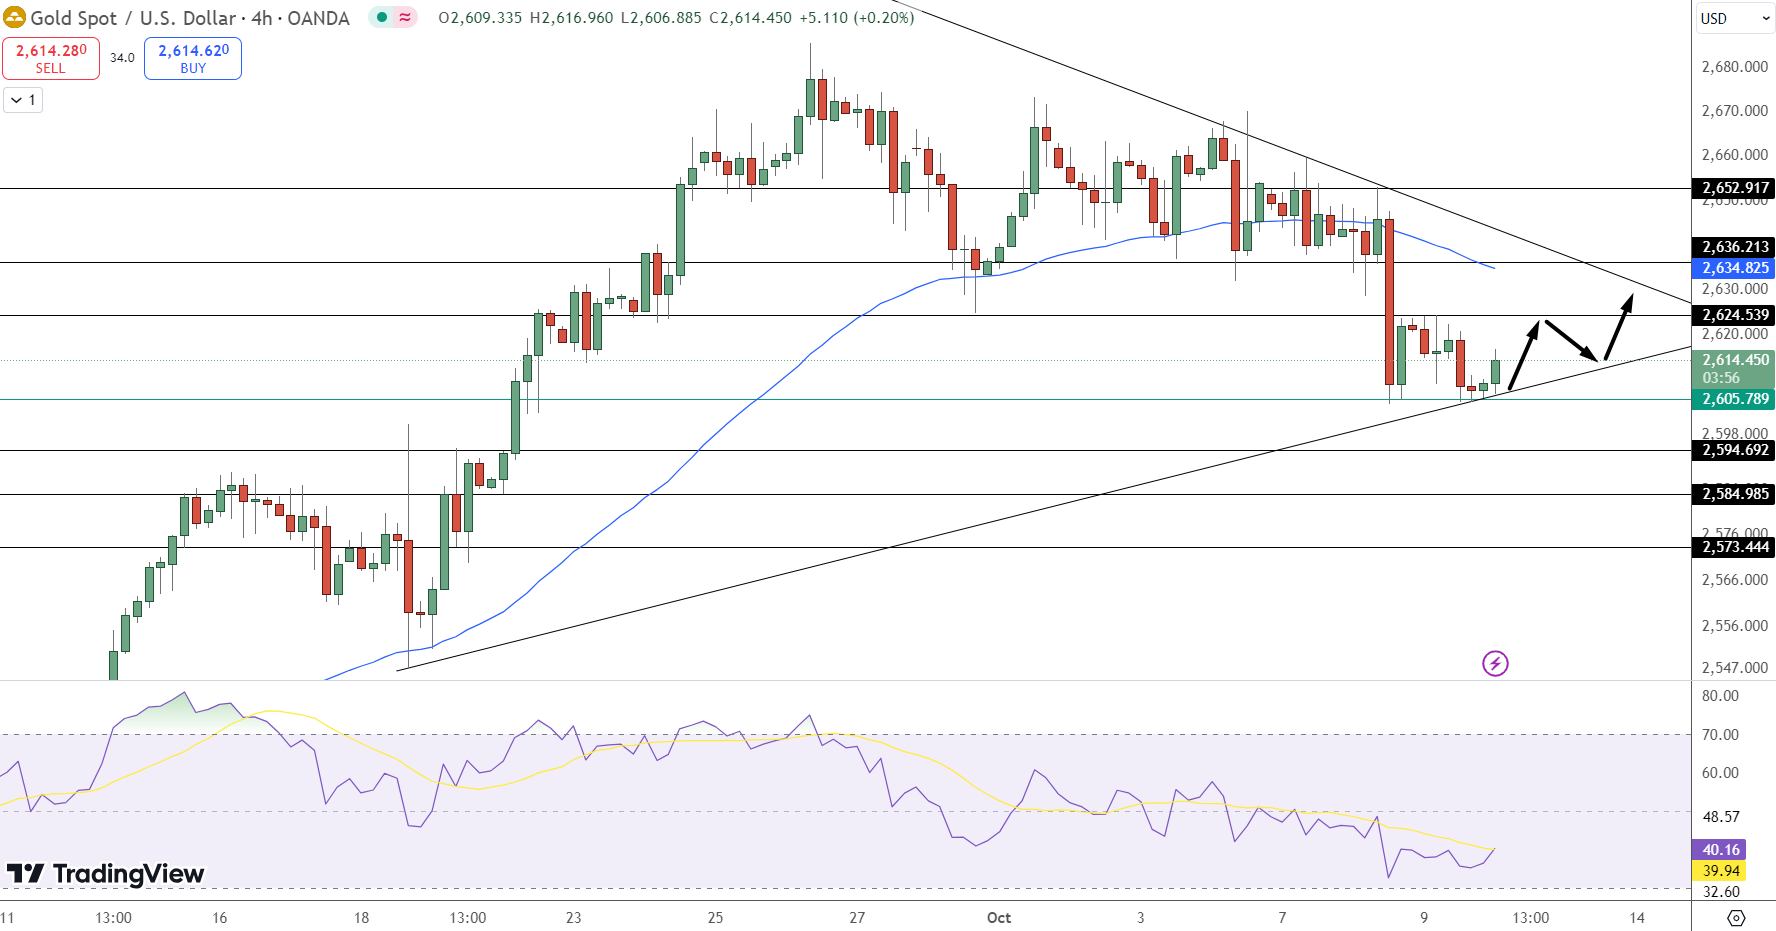
Gold is currently holding above a key support level at $2,605, supported by an upward trendline on the 4-hour chart. As long as the price remains above this trendline, a potential bullish reversal could be in play. Immediate resistance is seen at $2,624, with the next target at $2,636, coinciding with the 50-day Exponential Moving Average (EMA). Breaking above $2,636 could open the door to $2,652.
Gold held at $2,620, pressured by a strong US dollar and China’s vague stimulus plans. Investors await key CPI and PPI data for more clues. October 9th, 2024 pic.twitter.com/spKnecRCdl
— Russell Calkins (@RUSSELLCALKINS) October 9, 2024
However, if the $2,605 support is breached, gold may face increased selling pressure, pushing prices down to $2,594 and potentially $2,573. The Relative Strength Index (RSI) is currently at 40, indicating neutral sentiment but is approaching oversold territory, which could lead to a short-term rebound.
Key Insights:
-
FOMC Impact: The Fed’s Minutes reveal divided opinions on rate cuts, adding pressure on gold.
-
CPI Expectations: Upcoming US CPI data will be crucial in determining short-term direction.
-
Technical Outlook: $2,605 serves as key support; a break below could trigger further downside.
Overall, the upcoming economic data and the Fed’s stance will play a critical role in shaping gold’s trajectory. Traders should closely monitor the $2,605 support level and $2,624 resistance for potential breakout signals.
- Check out our free forex signals
- Follow the top economic events on FX Leaders economic calendar
- Trade better, discover more Forex Trading Strategies
- Open a FREE Trading Account
- Read our latest reviews on: Avatrade, Exness, HFM and XM
Related Articles


Sidebar rates
Related Posts
