Boxer Retail Nears 7,098—JSE Top 40 Retail Stocks Pop
Boxer Retail (JSE: BOXR) is currently trading around 6,742, hovering just above the crucial 50% Fibonacci retracement level at 6,701.
Quick overview
- Boxer Retail is trading around 6,742, just above the critical 50% Fibonacci retracement level of 6,701.
- The stock is forming a bearish descending triangle pattern, indicating potential downside risk as the MACD has turned negative.
- A sustained move above 6,865 could signal a bullish reversal, targeting 7,098, while a drop below 6,701 may lead to further declines.
- Traders are advised to consider a long position above 6,865 with a stop loss at 6,701 to manage risk.
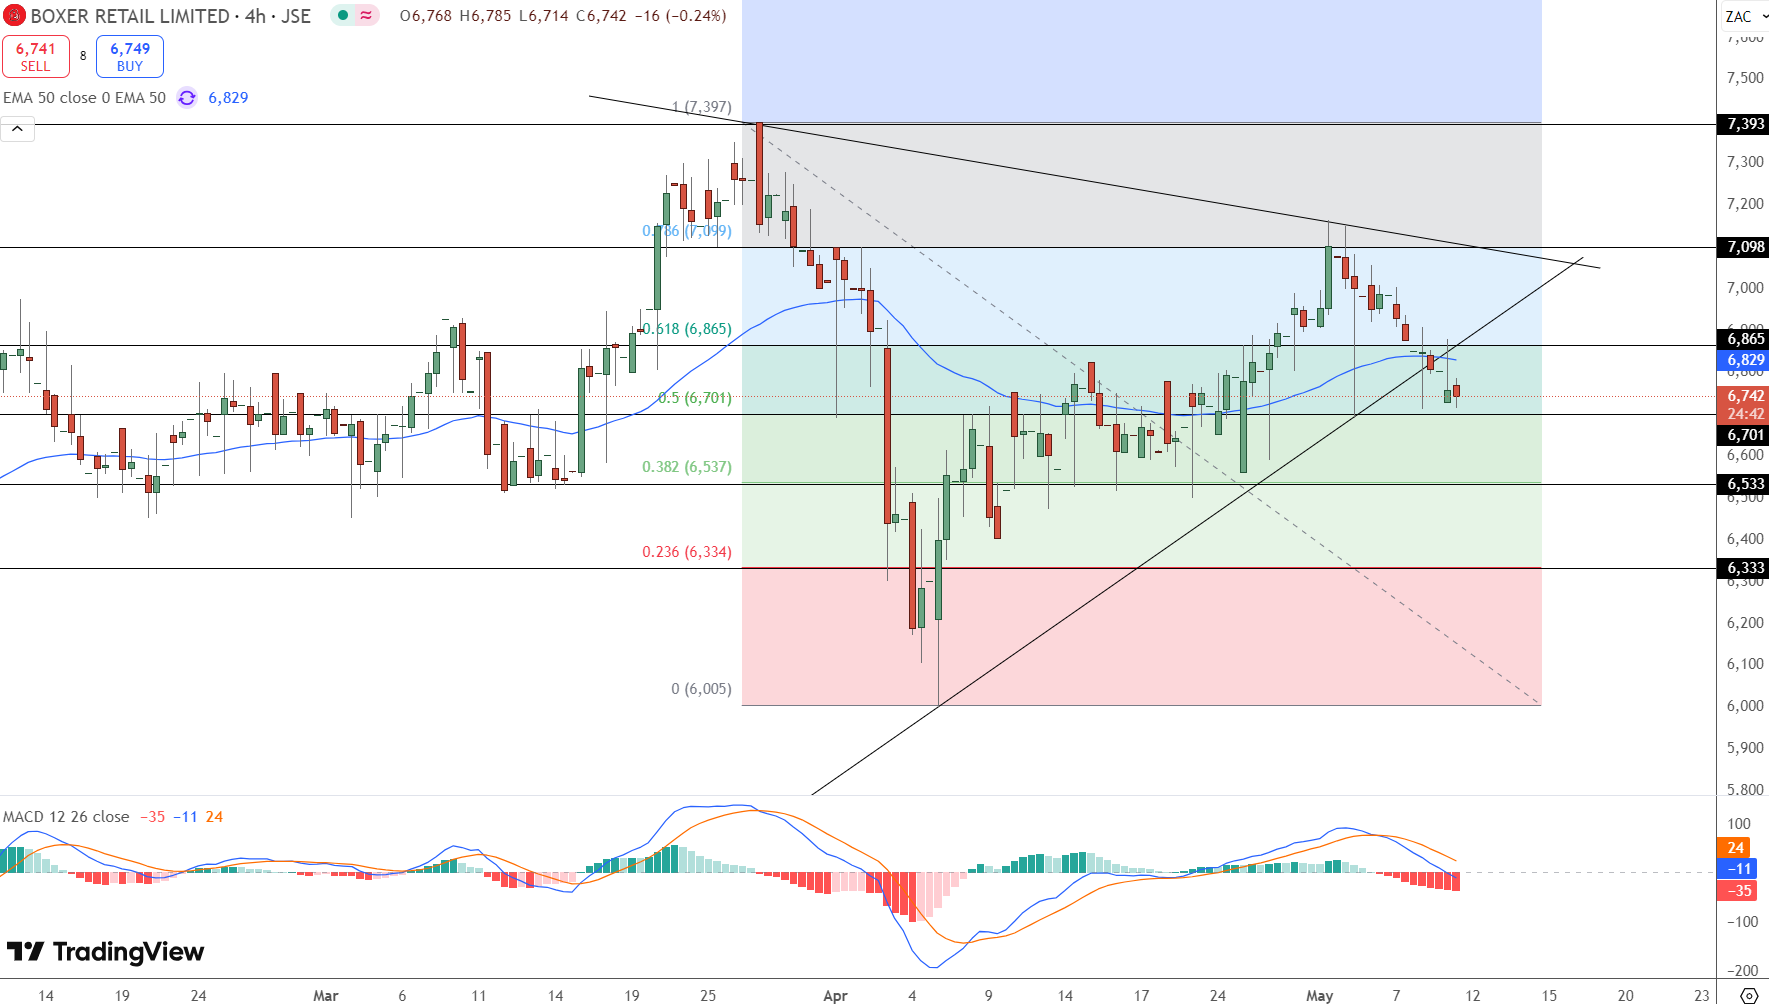
Boxer Retail (JSE: BOXR) is currently trading around 6,742, hovering just above the crucial 50% Fibonacci retracement level at 6,701.
This level is critical as it aligns closely with the 50-period Exponential Moving Average (EMA) at 6,829, which has acted as a dynamic resistance in recent sessions.
A sustained move above this zone could signal a bullish reversal, but the broader market sentiment remains cautious.
Bearish Triangle Pattern Signals Potential Risk
The stock is consolidating within a descending triangle, a pattern often associated with bearish momentum. This structure suggests that sellers may still have the upper hand, particularly as the Moving Average Convergence Divergence (MACD) has crossed into negative territory.
This bearish signal indicates a possible shift in momentum, adding to the downside risk if the price fails to break above key resistance levels.
However, if the price can hold above the 6,701 support, it may stage a recovery, targeting the 61.8% Fibonacci level at 6,865, followed by the upper boundary of the triangle near 7,098.
Breaking above this zone would invalidate the bearish pattern and could trigger a fresh rally toward the 7,393 high.
Potential Trade Setup for Short-Term Bulls
-
Buy Above: 6,865
-
Take Profit: 7,098
-
Stop Loss: 6,701
Strategy: Consider entering a long position if the price breaks above 6,865, targeting the next resistance at 7,098. Use a tight stop below 6,701 to manage risk, as a drop below this level could trigger a deeper correction toward 6,533, potentially reversing the recent recovery.
- Check out our free forex signals
- Follow the top economic events on FX Leaders economic calendar
- Trade better, discover more Forex Trading Strategies
- Open a FREE Trading Account
- Read our latest reviews on: Avatrade, Exness, HFM and XM
Related Articles
Sidebar rates
