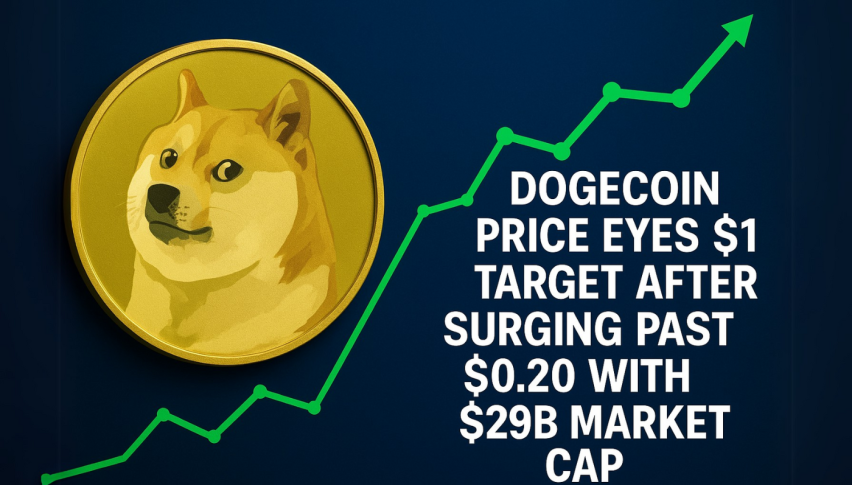
Dogecoin Price Eyes $1 Target After Surging Past $0.20 With $29B Market Cap
Dogecoin (DOGE) has once again caught investor attention, going past $0.20 for the first time in months. The popular meme coin...
Quick overview
- Dogecoin (DOGE) has surpassed $0.20, reaching a market cap of over $29 billion, indicating renewed investor interest.
- The recent price movement has sparked comparisons to its 2021 bull run, although current levels remain below its all-time high of $0.74.
- Technical indicators show strong buying interest, with DOGE breaking key Fibonacci levels and a bullish outlook for further gains.
- The broader crypto market's shift towards altcoins, driven by Ethereum's performance, is fueling Dogecoin's rally.
Dogecoin (DOGE) has once again caught investor attention, going past $0.20 for the first time in months. The popular meme coin now has a market cap of over $29 billion, signaling a new wave of optimism in the altcoin space. As Ethereum continues to outperform Bitcoin, analysts are saying it’s the start of a new “altcoin season” and Dogecoin is leading the charge.
DOGE’s move has brought back memories of its 2021 bull run when it briefly hit an all-time high of $0.74. While the current price is far from that, the momentum is growing and the technicals are strong. According to CoinMarketCap, Dogecoin is now in the top 10 by market cap, so it’s not just a meme coin anymore.
Technical Analysis: DOGE/USD Looks Up
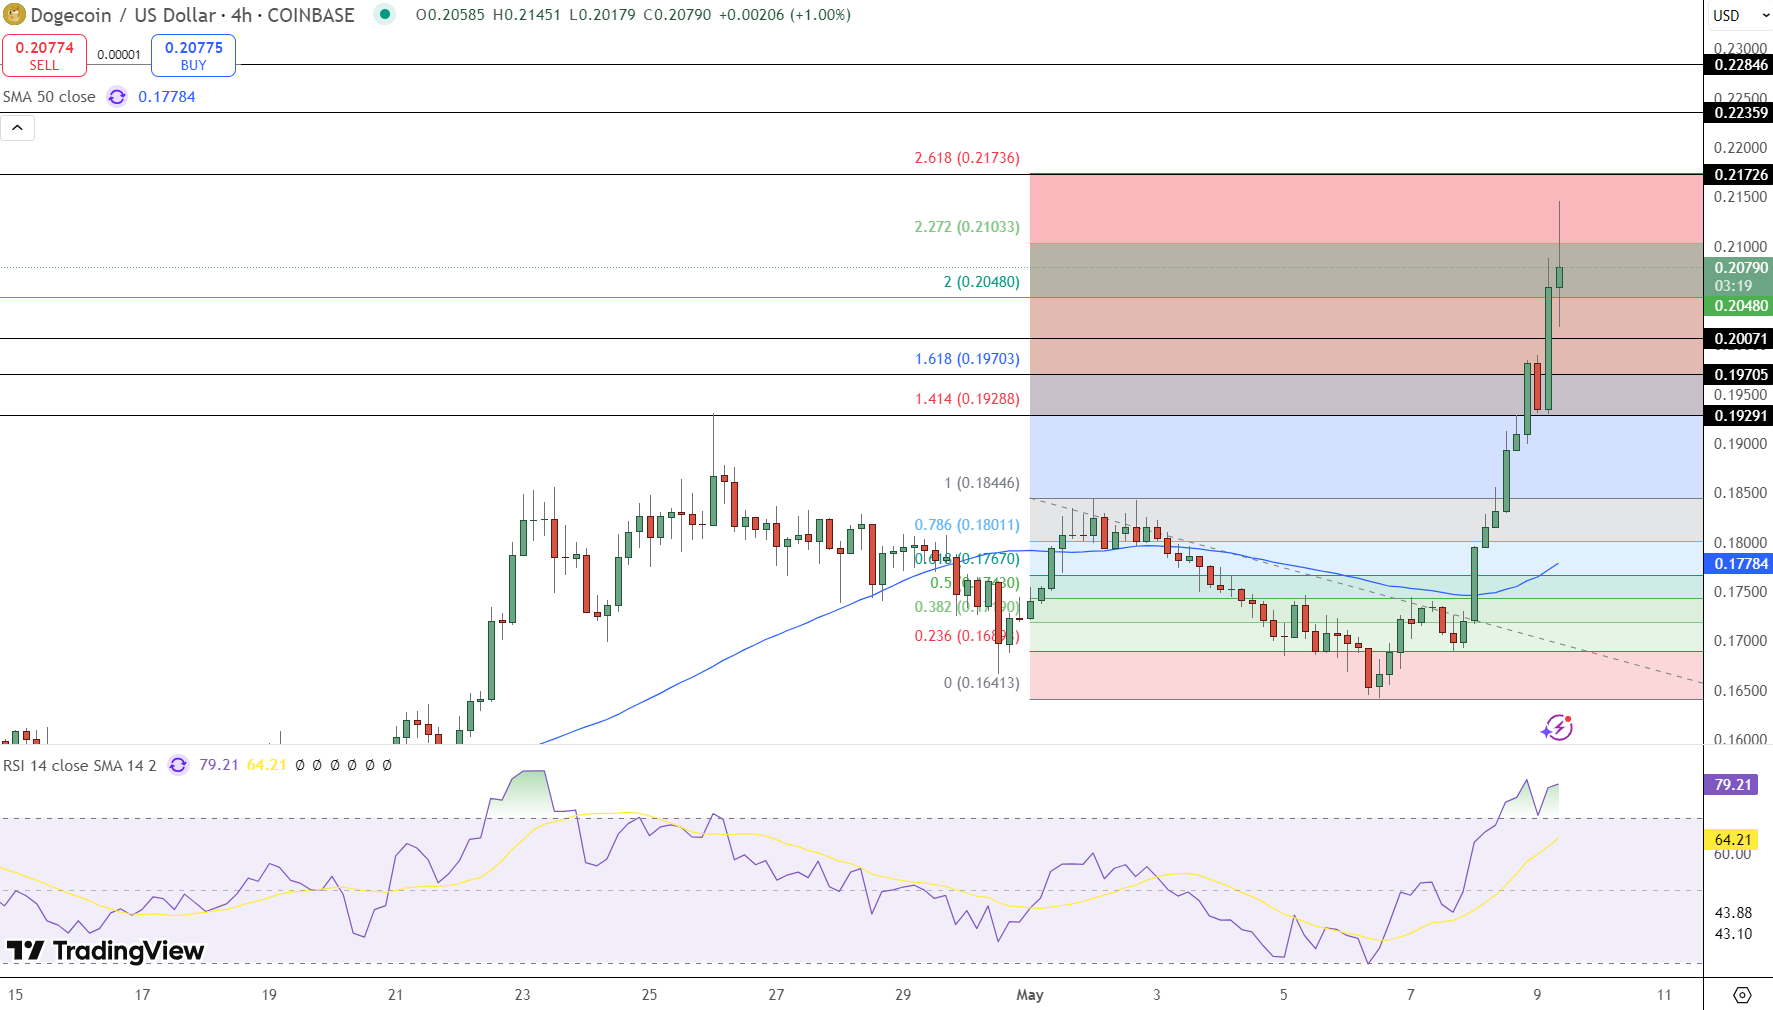
Dogecoin (DOGE/USD) is trading at $0.2078 after a big move up from $0.1778 support, breaking past key Fibonacci levels. The 50 SMA at $0.1778 was the launchpad for the recent move, showing strong buying interest. RSI is at 79.20, so we might see a short term pullback.
DOGE has just broken the 1.618 Fibonacci extension at $0.1970, so it’s a bullish breakout. Next resistance is the 2.272 Fibonacci extension at $0.2103, then the 2.618 level at $0.2173. If it pulls back, support is at the 1.414 Fibonacci level at $0.1928.
Trade Setup:
-
Buy Above: $0.2000
-
Take Profit: $0.2173
-
Stop Loss: $0.1928
Strategy: Enter long if price holds above $0.2000, targeting the next Fibonacci level at $0.2173. Set a tight stop below $0.1928 to manage risk, as RSI is showing cooling off. Monitor volume to confirm buying pressure at breakout levels.
Key Technical Highlights:
-
DOGE bounced from 50 SMA at $0.1778
-
Broke 1.618 Fibonacci at $0.1970* Next resistance: $0.2103 and $0.2173
-
RSI 79.20
-
Market cap over $29 billion
Altcoin Season Frenzy Fuels Dogecoin’s Rally
The broader crypto market is also helping Dogecoin’s move. Ethereum’s outperformance over Bitcoin has shifted attention to smaller cap coins, a trend that happens during altcoin seasons. This cycle sees investors moving away from large cap assets to smaller ones for higher returns.
- Check out our free forex signals
- Follow the top economic events on FX Leaders economic calendar
- Trade better, discover more Forex Trading Strategies
- Open a FREE Trading Account
- Read our latest reviews on: Avatrade, Exness, HFM and XM
Related Articles
Sidebar rates
