Solana Faces Short-Term Dip Below $175 Despite Bullish Technical Signals and Institutional Interest
Solana (SOL) is currently trading at around $173, down 4.7% in the past 24 hours, yet technical indicators and recent institutional
Quick overview
- Solana is currently trading at around $173, down 4.7% in the past 24 hours, but technical indicators suggest a potential bullish outlook.
- VanEck's inclusion of Solana in its Multi-Chain Treasury Fund enhances its institutional reputation, allowing for lower minimum investments compared to Ethereum.
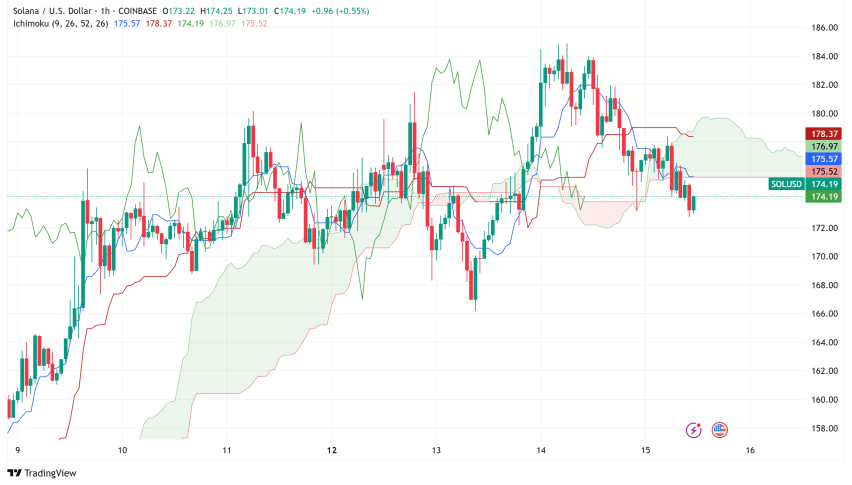
- Technical analysis indicates Solana has broken above the Ichimoku Cloud, signaling a possible trend reversal, with key resistance levels identified at $180 and $211.
- Elliott Wave analysis suggests that Solana could target prices as high as $360, but a daily close below $172 may indicate a price correction.
Solana SOL/USD is currently trading at around $173, down 4.7% in the past 24 hours, yet technical indicators and recent institutional developments suggest a bullish outlook may be forming despite the short-term correction.

VanEck’s Multi-Chain Treasury Fund Includes Solana as Key Network
With VBILL, a tokenized U.S. Treasury fund running across several blockchains including Solana, asset management behemoth VanEck has significantly raised Solana’s institutional reputation. With a minimum investment of $100,000 for Solana-based exposure—versed against $1 million on Ethereum—the fund places SOL as one of the selected platforms for institutional capital flows alongside Ethereum, Avalanche, and BND Chain.
“Tokenized funds like VBILL improve market liquidity and efficiency,” stated Kyle DaCruz, Director of Digital Assets Product at VanEck, underlining the mounting institutional interest in blockchain infrastructure. The news comes as the larger tokenized asset market approaches a $3.5 billion capitalization after a little 0.4% retreat this week.
Industry watchers point out that VanEck’s choice to include Solana marks a calculated recognition of the network’s effectiveness and increasing institutional appeal. Under Securitize’s supervision of fund compliance and Wormhole’s cross-chain interoperability, the VBILL launch fits BlackRock’s BUIDL program and places tokenized treasuries as fundamental infrastructure for the next wave of cryptocurrency adoption.
SOL/USD Technical Analysis Points to Potential Upside
Solana has broke above the Ichimoku Cloud on the daily chart following weeks of sideways trade, a technical pattern usually indicating a trend reversal. Positive momentum indicators, most especially the Moving Average Convergence Divergence (MACD), have accompanied this important change in market structure.
Having both the MACD line and signal line currently above the zero level, the MACD has lately achieved a bullish crossover. Though analysts point out that consistent volume is required to turn this breakout into a long-lasting trend, this double confirmation reinforces the case for positive momentum.
Recent technical evaluations show Solana has passed immediate resistance around $164 and seems to be preparing for a slide toward the next major resistance level at $211. With support at $172 on the hourly chart, the development of a short-term descending channel or bullish flag pattern points to a transient downturn in present movement.
SOL Derivatives Data Shows 83-Day Long Position Streak
The longest such run since the 2021 bull market—83 consecutive days—Solana’s perpetual futures markets have remarkably maintained positive taker CVD (Cumulative Volume Delta). This protracted era of derivatives hope contrasts sharply with SOL’s spot price, which stays about 30% below its most recent top.
This difference between spot price action and future market mood begs serious issues about market dynamics. While futures traders keep positioned for upside, the lag in spot prices could either point to an approaching spike as spot buyers join the market or imply possible market correction should the gap not shrink.
Key Support and Resistance Levels to Watch
Traders negotiating Solana’s current price action pay attention to several important price levels:
Resistance Levels:
- $180: Immediate resistance that must be cleared for continued upward momentum
- $185: A breach above this level could accelerate the rally
- $191.25: Key Fibonacci extension level identified by Elliott Wave analysis
- $211: Major resistance level that could open the path to $240
Support Levels:
- $172: Critical support that must hold to maintain bullish momentum
- $170: Secondary support level with significant psychological importance
- $162: Breaking below this level could trigger a deeper correction toward $150
Elliott Wave Analysis Points to $360 Target
Elliott Wave analysis reveals Solana’s recent movement creates a “five-wave pattern” that could possibly signal the start of a more significant impulse wave, hence generating more aspirational price estimates. Under this scenario, independent analyst More Crypto Online (MCO) says the current structure reflects wave 1 of a bigger pattern that might finally approach $360 or higher.
MCO warns, meanwhile, that a daily close below $172 would suggest that a price top has developed and would cause a retracing toward the upper-$160s or perhaps the mid-$150s before the next leg up starts.
Solana Price Prediction: What’s Next?
Solana’s short-term price action shows some weakness with the 4.7% daily loss, but combined institutional adoption via VanEck’s VBILL fund, technical breakout above the Ichimoku Cloud, and favorable derivatives sentiment makes a strong case for a possible bullish continuation.
To validate the optimistic view, traders should pay great attention to if SOL can sustain support at $172 and subsequently break above $180. Solana seems positioned for a possible rally toward the psychologically important $200 level in the near term, with more significant gains possible if the Elliott Wave projections materialize, with major institutional developments providing basic support and technical indicators suggesting momentum is changing.
- Check out our free forex signals
- Follow the top economic events on FX Leaders economic calendar
- Trade better, discover more Forex Trading Strategies
- Open a FREE Trading Account
- Read our latest reviews on: Avatrade, Exness, HFM and XM