Ethereum Technical Signals Point to Potential $3,000 Rally Despite Recent 4% Drop
Ethereum (ETH) is currently holding just under $2,400, down nearly 4% in the past 24 hours as the world's second-largest cryptocurrency
Quick overview
- Ethereum is currently trading just below $2,400, experiencing a nearly 4% decline in the last 24 hours amid market uncertainty and significant liquidations.
- Technical analysis suggests a potential surge towards $3,700 if Ethereum maintains a daily close above $2,470, despite recent drops in the Relative Strength Index.
- Rising institutional demand, indicated by increasing ETH ETF holdings, reflects growing confidence in Ethereum's future performance.
- The ETH/BTC ratio has shown signs of recovery, suggesting a possible altcoin season ahead, but analysts caution that sustained momentum requires validation above the one-year moving average.
Ethereum ETH/USD is currently holding just under $2,400, down nearly 4% in the past 24 hours as the world’s second-largest cryptocurrency continues to navigate through a period of market uncertainty. The recent price action comes amid significant liquidations across the crypto market, with over $158 million in leveraged positions being wiped out in the last 24 hours according to CoinGlass data.
Multiple technical signals and on-chain data point to Ethereum perhaps getting ready for a significant surge in the next weeks despite the present retreat. Analysts are growing more sure that ETH might touch the $3,000 mark by the end of May, therefore reflecting a possible 25% rise from present levels.
Bull Flag Pattern Emerges: Technical Analysis Points to $3,700 Target
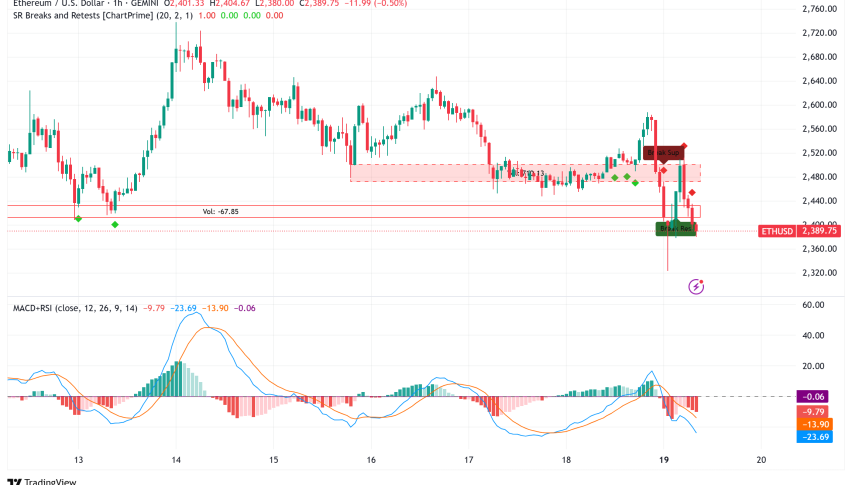
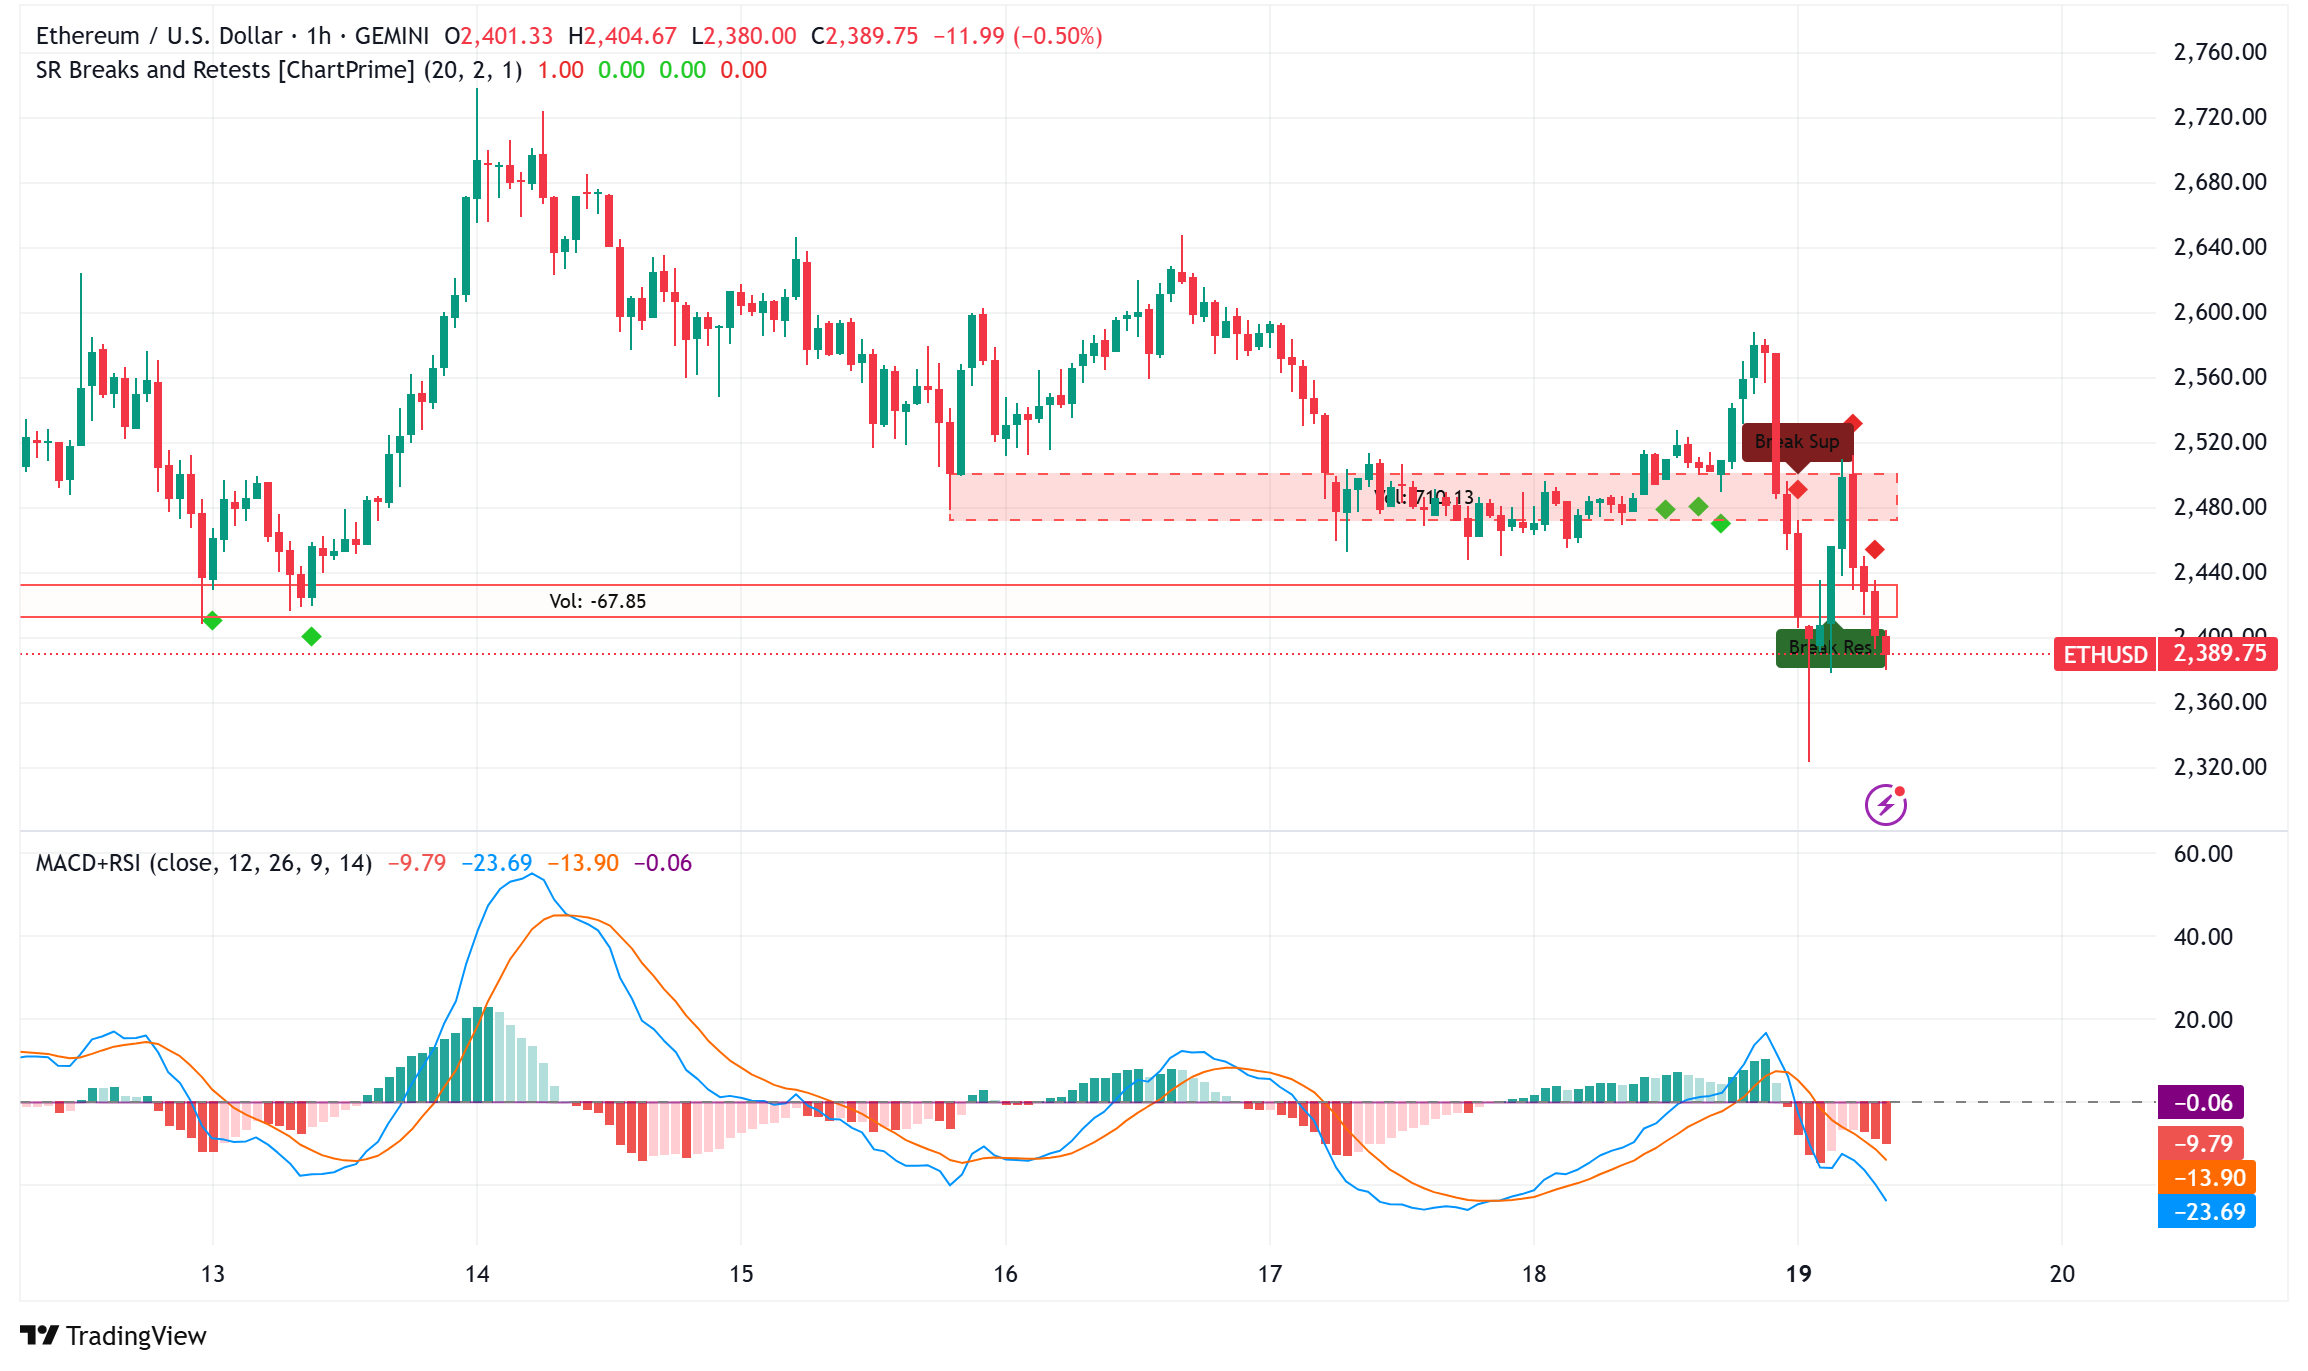
On the four-hour timescale, Ethereum’s price chart shows a striking bull flag pattern—a configuration seen as quite positive by technical analysts. May 13 reinforced this trend: the price broke above the upper trendline at $2,550; ETH is now retesting this level as support.
Technical forecasts indicate that if Ethereum can keep a daily close above the $2,470 line, the asset may start its rise toward the target of roughly $3,700, thereby reflecting a possible 50% increase from present values. But the Relative Strength Index (RSI) has dropped from 60 to 42 over the past 24 hours, suggesting that should profit-taking get more intense, the slump would continue.
Major support levels to monitor include $2,400, $2,350, and the crucial $2,300 mark, which lines the bull flag pattern’s lower bound. Should these levels fall short, more significant adjustments to $2,220 and maybe even $1,800 could show before the next move up.
Institutional Demand Rising: ETH ETF Holdings Signal Growing Confidence
The consistent rise in ETH ETF holdings since late April is among Ethereum’s most encouraging trends. Driven by continuous scaling improvements and favorable macroeconomic conditions, a CryptoQuant study shows that this trend reflects increasing institutional confidence in Ethereum’s ability to outperform in the next months.
The research notes that the ETH/BTC ETF holdings ratio and price ratio have been rising concurrently, implying intentional portfolio changes by big institutional investors. Ethereum’s possible comeback and later surge have a basic basis thanks to this increasing institutional curiosity.
Exchange Dynamics: Reduced Selling Pressure Points to Bullish Outlook
Historically before ETH price surges, on-chain data shows that Ethereum exchange inflows have dropped to their lowest levels since 2020. Usually indicating lower selling pressure, lower exchange inflows mean fewer tokens are being transferred to exchanges for possible liquidation.
Recent market behavior clearly shows this lowered selling pressure: ETH short liquidations totaling $22.25 million in the previous 24 hours – including $7.5 million wiped away in a single hour after yesterday’s fleeting rally to $2,550. These liquidations point to Ethereum’s resiliency catching negative traders off guard.
ETH/BTC Ratio: Historical Bottom Formation Suggests Altcoin Season Ahead
Ethereum’s relative value against Bitcoin offers maybe the most interesting sign. After reaching its lowest level since January 2020, the ETH/BTC price ratio has jumped 38%. CryptoQuant analysts note that the ETH/BTC MVRV metric has now reached a “extreme undervaluation zone” for the first time since 2019.
Similar circumstances in 2017–2019 historically suggested substantial mean-reversion potential since they preceded times when ETH notably outperformed Bitcoin. Reflecting trends from 2019–2021 when Ethereum surpassed Bitcoin by 400%, ETH’s spot trading volume relative to BTC also surged to 0.89 last week – the biggest since August 2024.
To validate a sustained increasing trend, analysts warn, nonetheless, the ETH/BTC ratio must exceed its one-year moving average. Though present levels reflect historical bottoms, long-term momentum depends on this technical validation.
Ethereum Price Prediction
Beyond the near price activity, a number of basic elements might propel Ethereum toward fresh all-time highs around $5,000 in the next months. Among these are rising AI acceptance inside the Ethereum ecosystem, ongoing spot ETF inflows, and technical enhancements following the most recent Pectra upgrade.
Ethereum will see strong opposition ahead from large ask orders valued over $384 million piling up between present prices and the $3,000 mark. Analyst Titan of Crypto says, however, the weekly Stochastic RSI value of 79 indicates ETH “still has more gas in the tank” to continue higher.
Investors should stay wary of any retests of the $2,300-$2,400 support zone before the next major surge materializes as Ethereum negotiates this crucial junction and seek for a clear break over $2,550 as confirmation of renewed optimistic momentum.
- Check out our free forex signals
- Follow the top economic events on FX Leaders economic calendar
- Trade better, discover more Forex Trading Strategies
- Open a FREE Trading Account
- Read our latest reviews on: Avatrade, Exness, HFM and XM